


Table of Contents
Introduction
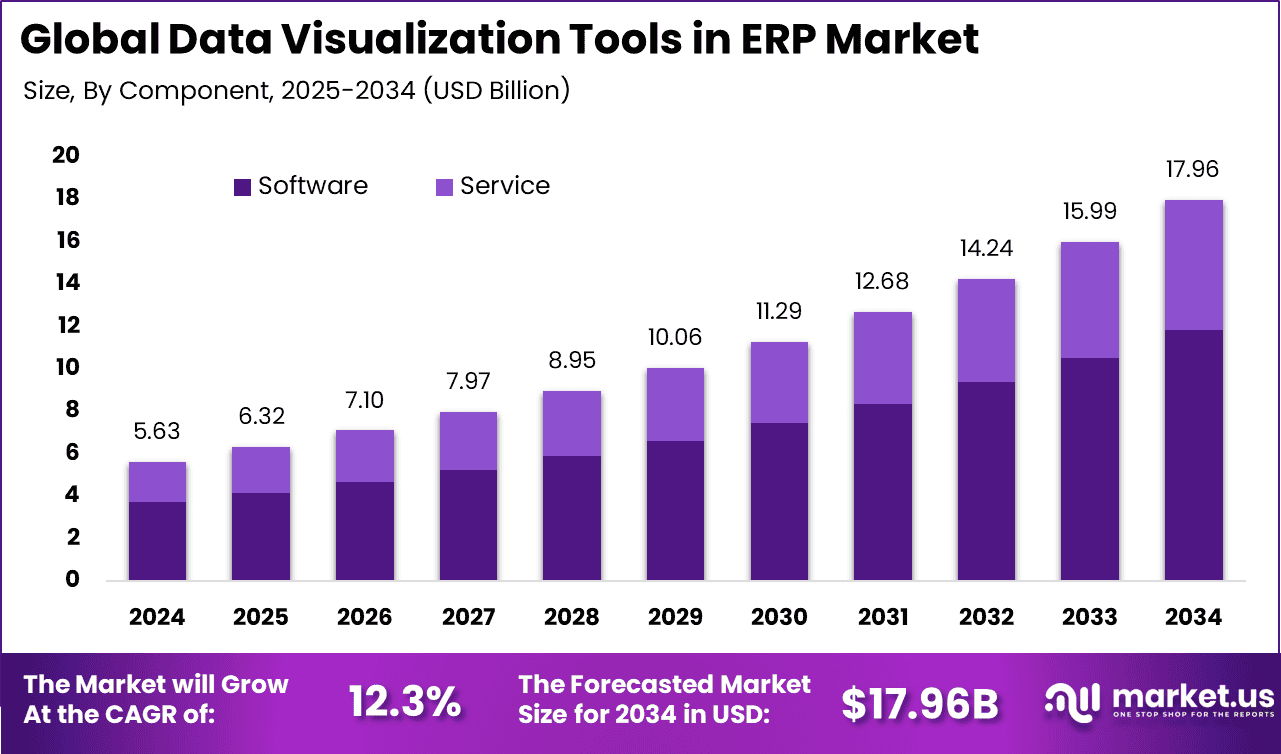
The global Data Visualization Tools in ERP Market is projected to grow significantly, reaching USD 17.96 billion by 2034, up from USD 5.63 billion in 2024, representing a compound annual growth rate (CAGR) of 12.3%. North America dominates the market, holding 42.6% of the share with USD 2.39 billion in revenue in 2024.
The increasing demand for data-driven insights and real-time decision-making within enterprise resource planning (ERP) systems is driving the adoption of data visualization tools. These tools are enhancing the ability to analyze, interpret, and present complex data, making them crucial for modern business operations.
How Growth is Impacting the Economy
The growth of the Data Visualization Tools in ERP Market is contributing to a transformation in how businesses operate and make decisions. As companies increasingly rely on data-driven insights, these tools are enhancing business intelligence capabilities and fostering informed decision-making. With the rising importance of real-time analytics, organizations can respond faster to market changes and customer needs, improving operational efficiency and reducing costs.
As companies adopt data visualization tools, they experience a reduction in decision-making time, enabling quicker actions that support business growth and innovation. The ability to make data-driven decisions also leads to a more productive workforce, enhancing overall economic output. Moreover, businesses leveraging data visualization tools are more likely to discover new revenue opportunities, improve customer satisfaction, and optimize resource allocation. The widespread use of these tools helps businesses across industries gain a competitive edge, supporting broader economic growth through increased productivity and innovation.
➤ Uncover best business opportunities here @ https://market.us/report/data-visualization-tools-in-erp-market/free-sample/
Impact on Global Businesses
The rise of Data Visualization Tools in ERP systems is significantly influencing global business operations. Companies adopting these tools can improve decision-making, enhance business agility, and streamline processes, which ultimately contributes to cost reduction and greater profitability. However, the implementation of these tools can also lead to increased software and training costs, impacting short-term budgets.
The impact of these tools is particularly felt in supply chain management, where businesses are leveraging data visualization to monitor real-time inventory, forecast demand, and optimize logistics. By integrating data visualization into ERP systems, organizations are improving the accuracy of their forecasting and resource management, resulting in smoother supply chain operations. Moreover, sector-specific impacts include enhanced financial reporting for enterprises in finance, improved HR management for employee-related data analysis in human resources, and more effective customer relationship management in retail and services sectors.
Strategies for Businesses
To capitalize on the growth of Data Visualization Tools in the ERP market, businesses should prioritize integrating these tools into their existing ERP systems. This involves evaluating the needs of different departments and selecting the right tools that cater to specific business functions. Additionally, companies should invest in training their teams to effectively use these tools for decision-making, ensuring they unlock their full potential.
Further, businesses should consider adopting cloud-based ERP solutions, as they offer scalability, cost-effectiveness, and easy integration with data visualization tools. Creating cross-functional teams to manage data-driven initiatives will help foster a culture of innovation, with departments working together to analyze and visualize key performance indicators (KPIs). By adopting these strategies, organizations can gain a competitive advantage and make more data-driven, informed decisions.
Key Takeaways
- The Data Visualization Tools in ERP Market is expected to grow from USD 5.63 billion in 2024 to USD 17.96 billion by 2034, at a CAGR of 12.3%.
- North America leads the market, accounting for 42.6% of the share in 2024 with USD 2.39 billion in revenue.
- Data visualization tools are essential for improving business decision-making, enhancing operational efficiency, and streamlining supply chain management.
- Businesses need to integrate these tools effectively into their ERP systems and focus on training to maximize their potential.
➤ Buy Report Here @ https://market.us/purchase-report/?report_id=152564
Analyst Viewpoint
The Data Visualization Tools in ERP Market is experiencing steady growth, driven by the need for real-time data analysis and enhanced decision-making capabilities. Presently, businesses are increasingly investing in these tools to gain deeper insights into their operations and improve efficiency.
Moving forward, we anticipate continued advancements in AI-powered data visualization tools, offering even more intuitive and actionable insights for businesses. The future of this market looks positive, with significant opportunities for growth as businesses across industries embrace data-driven decision-making.
Regional Analysis
North America holds a dominant position in the Data Visualization Tools in ERP Market, accounting for 42.6% of the market share in 2024, with USD 2.39 billion in revenue. The region benefits from a high level of technological adoption and a mature ERP market. Europe and Asia Pacific are expected to experience strong growth as well, with businesses in these regions increasingly adopting data-driven solutions to improve business operations. The adoption of data visualization tools is particularly strong in industries such as manufacturing, retail, and finance, where accurate and timely data insights are crucial for decision-making.
➤ Discover More Trending Research
- SME Insurance Market
- Automation Outsourcing Market
- Software Development Outsourcing Market
- AI Code Assistant Market
Business Opportunities
The rapid growth of Data Visualization Tools in the ERP Market presents numerous opportunities for businesses. Companies can capitalize on the increasing demand for advanced analytics solutions by offering customized data visualization tools tailored to specific industry needs. There is also an opportunity for software vendors to partner with ERP providers, offering integrated solutions that enhance the functionality of existing ERP systems. Additionally, businesses offering cloud-based ERP and data visualization tools can tap into the growing market for scalable and cost-effective solutions. These opportunities will continue to drive innovation and growth within the sector.
Key Segmentation
The Data Visualization Tools in the ERP Market can be segmented based on deployment type, end-user industry, and region. By deployment, the market is divided into on-premises and cloud-based solutions, with cloud-based tools expected to lead due to their scalability and cost-effectiveness. The end-user industries include manufacturing, retail, finance, healthcare, and government organizations, with manufacturing and finance leading the demand for these tools. Geographically, North America, Europe, and the Asia Pacific dominate the market, with North America holding the largest share due to high levels of ERP adoption and technological infrastructure.
Key Player Analysis
In the Data Visualization Tools in ERP Market, key players are focusing on developing innovative solutions that integrate seamlessly with existing ERP systems. These companies are enhancing the user experience by making their tools more intuitive, offering customizable dashboards, and incorporating advanced analytics features such as AI and machine learning. Additionally, partnerships and acquisitions are becoming more common as vendors work to expand their product offerings and market reach. As competition intensifies, businesses will continue to innovate to meet the growing demand for data visualization and analytics solutions.
- Salesforce, Inc.
- Alibaba Cloud
- Oracle Corporation Company Profile
- Amazon Web Services, Inc.
- SAS Institute Inc.
- Sisense Inc.
- Microsoft Corporation Company Profile
- TIBCO software
- International Business Machines Corporation Company Profile
- SAP SE Company Profile
- Others
Recent Developments
- The integration of AI and machine learning with data visualization tools is enhancing data insights and decision-making.
- Cloud-based ERP solutions are gaining traction, allowing businesses to access data visualization tools from anywhere.
- Companies are focusing on improving the user experience with more intuitive interfaces and customizable features.
- Vendors are increasingly partnering with ERP providers to offer integrated solutions that enhance functionality.
- New tools are being developed to support real-time data visualization, helping businesses make faster, more informed decisions.
Conclusion
The Data Visualization Tools in ERP Market is experiencing strong growth, driven by the increasing demand for data-driven decision-making across industries. As businesses continue to adopt these tools, they will gain a competitive advantage, improve efficiency, and unlock new business opportunities. The future of this market looks promising, with ongoing innovations and increasing adoption globally.
Discuss your needs with our analyst
Please share your requirements with more details so our analyst can check if they can solve your problem(s)