


Table of Contents
- Introduction
- Editor’s Choice
- Global Augmented Reality (AR) Market Size Statistics
- AR Market Segmentation by Industry
- AR Average Revenue Per User
- Augmented Reality Statistics by AR User
- User Adoption and Engagement
- AR Devices and Hardware
- Augmented Reality Statistics by AR Applications
- AR/VR Platforms Receiving Attention From Game Developers
- Augmented Reality Statistics by AR Glasses
- Recent Developments
- Conclusion
- FAQs
Introduction
Augmented Reality Statistics: Augmented Reality, or AR, is a technology that combines the physical world with digital content. Enriching reality by overlaying computer-generated elements.
Unlike virtual reality (VR), which immerses users entirely in virtual worlds, AR enhances the real world by adding digital features. It’s a versatile tool with applications across various industries.
AR is rapidly advancing and finding uses in gaming, healthcare, education, retail, and industry. However, It can transform how we interact with information, the world, and each other.
As technology progresses and becomes more accessible, AR will likely play an increasingly important role in our daily lives.
Extended Reality (XR) refers to a spectrum of technologies that combine virtual reality (VR), augmented reality (AR), and mixed reality (MR) to create Immersive-reality and interactive experiences.

Editor’s Choice
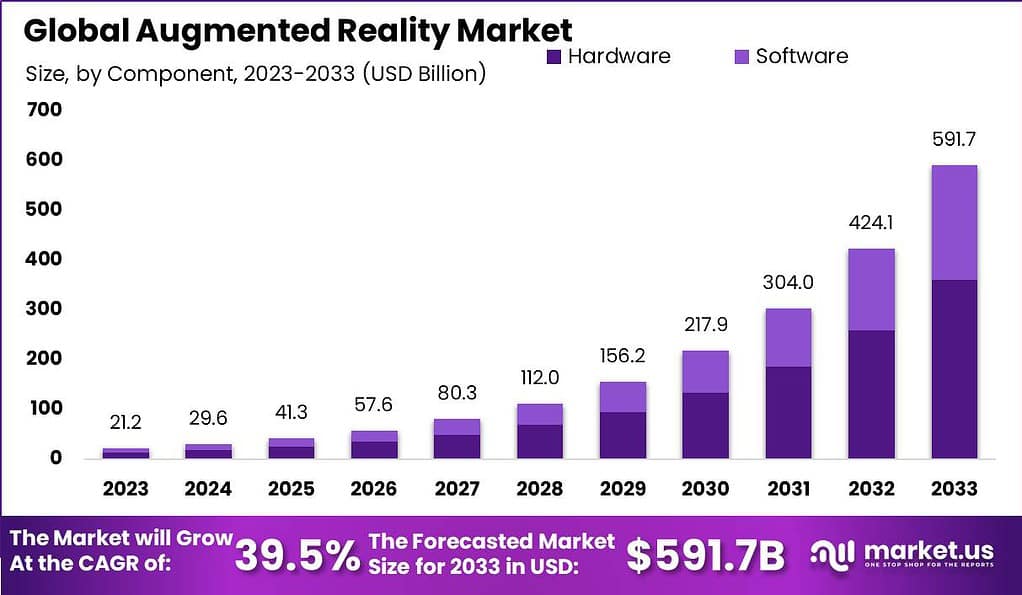
- The global Augmented Reality Market is anticipated to be USD 591.7 billion by 2033. It is estimated to record a steady CAGR of 39.5% in the Forecast period 2024 to 2033. It is likely to total USD 29.6 billion in 2024.
- The AR and VR market is expected to grow at an annual rate of 13.72% from 2023 to 2027. They are ultimately reaching an estimated market size of US$52.05 billion in 2027.
- Among the market segments, AR Software is the most prominent. We are forecasted to have a market value of around US$11.58 billion in 2023.
- The United States is set to be the leading revenue generator in 2023, with an expected market volume of US$8.57 billion.
- In terms of users, the AR and VR market is anticipated to reach approximately 2,593.0 million users by 2027.
- The user penetration rate is expected to surpass 28.8% in 2023 and is projected to rise to 32.6% by 2027.
- The average revenue per user (ARPU) is expected to be around US$14.08.
Global Augmented Reality (AR) Market Size Statistics
- The augmented reality (AR) market has grown remarkably in recent years.
- In 2017, the market was valued at approximately USD 3.48 billion; by 2018. It had already surged to USD 5.91 billion.
- These early figures signified the increasing interest and adoption of AR technology. The AR market is poised for explosive growth. With projections estimating a market size of around USD 198.17 billion by 2025.
- This staggering growth underscores the widespread integration of AR across diverse industries. From gaming and entertainment to healthcare, education, and beyond.
- The substantial increase in market size reflects the technological advancements in AR and its growing acceptance among consumers and businesses alike.
(Source: Statista)

AR Market Segmentation by Industry
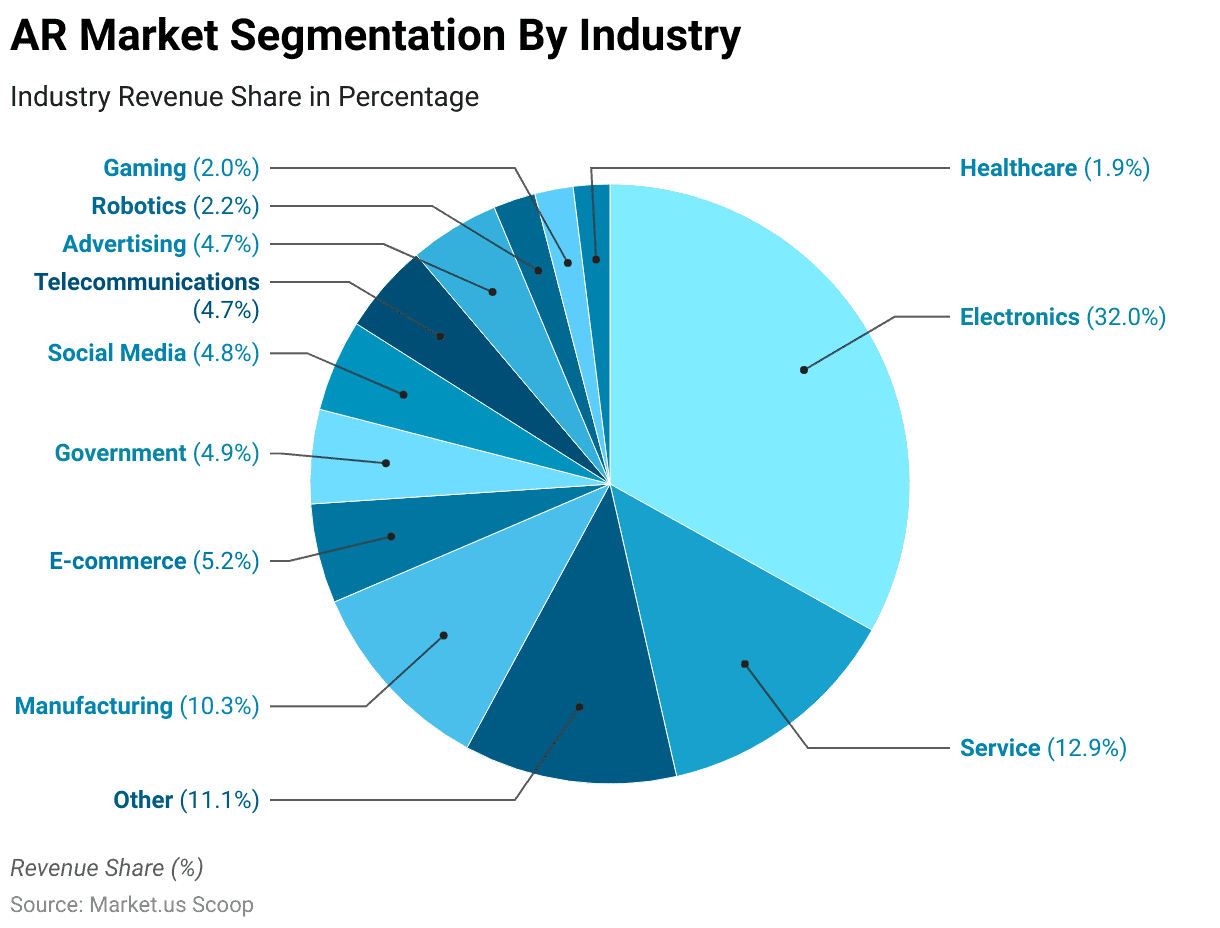
- The revenue distribution across various industries reveals exciting insights into the market landscape. Electronics takes the lead with the largest share at 32.0%, demonstrating its significant presence in the overall revenue generation.
- Following closely behind are services with a 12.9% share and manufacturing at 10.3%, highlighting their substantial contributions.
- E-commerce, government, and social media sectors contribute 5.2%, 4.9%, and 4.8%, respectively, showcasing their relevance in the market.
- Telecommunications and advertising both hold a share of 4.7%.
- Meanwhile, robotics and gaming represent 2.2% and 2.0% of the revenue, respectively, while healthcare follows closely at 1.9%.
- The remaining 11.1% falls into the ‘Other’ category, encompassing various sectors that also play a noteworthy role in the industry’s revenue makeup.
(Source: Statista)
AR Average Revenue Per User
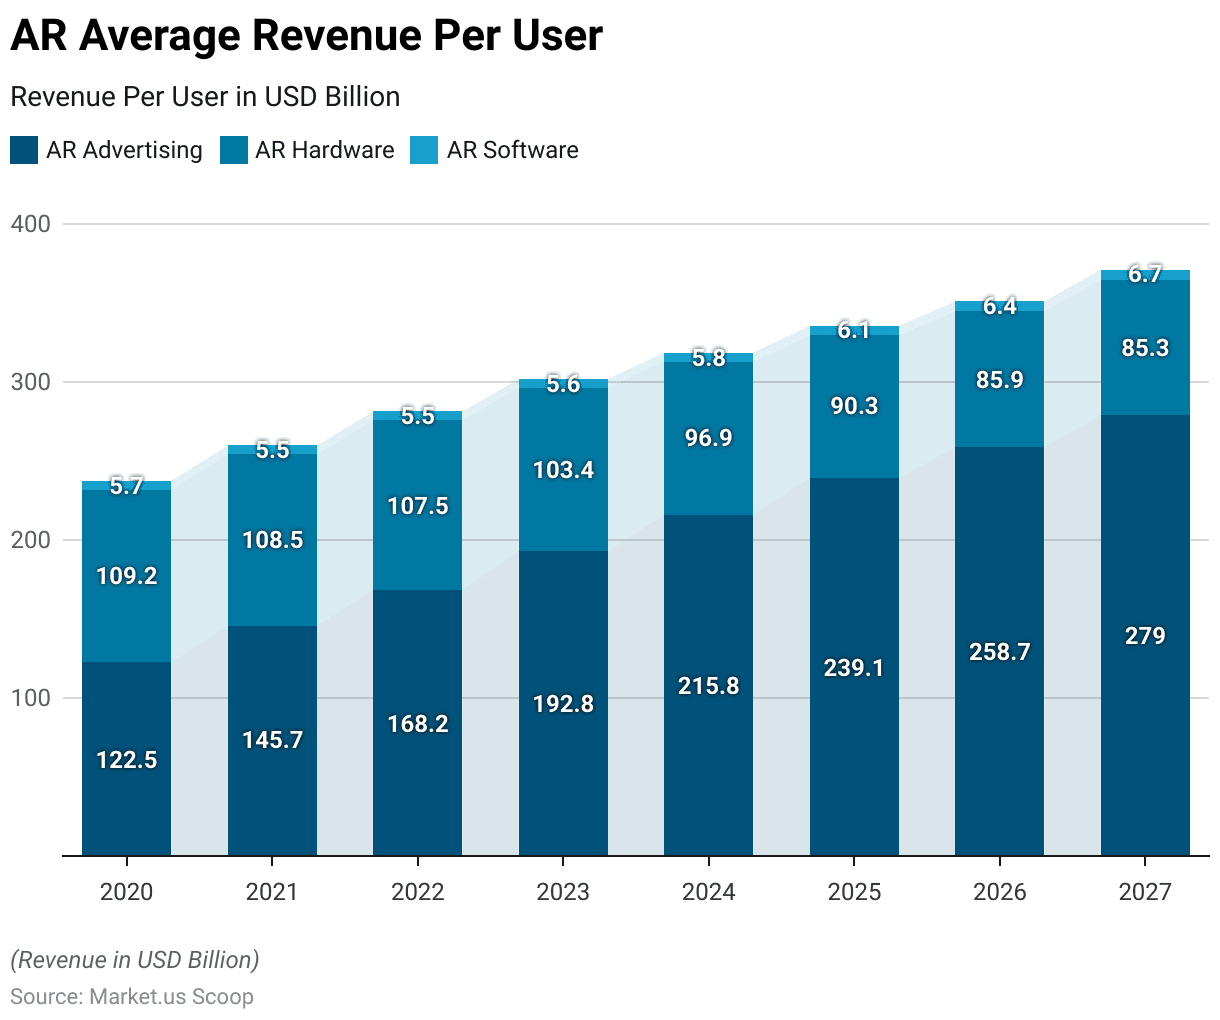
- Between 2020 and 2027, the average revenue per user (ARPU) in various augmented reality (AR) sectors saw notable trends.
- In the AR Advertising sector, ARPU started at 122.5 billion USD in 2020 and consistently increased, reaching 279 billion USD in 2027.
- Meanwhile, ARPU began at 109.2 billion USD in 2020 in the AR Hardware sector but gradually decreased to 85.31 billion USD in 2027.
- In contrast, the AR Software sector maintained a relatively stable ARPU. Starting at 5.71 billion USD in 2020 and ending at 6.66 billion USD in 2027. These figures reflect the evolving landscape of AR technologies and their varying revenue potentials over this period.
(Source: Statista)
Augmented Reality Statistics by AR User
- Every year, there has been a steady growth in the usage of active AR user devices.
- In 2019, the count stood at around 440 million devices.
- By 2021, this number had almost doubled, reaching approximately 810 million.
- As we move into 2023, we find ourselves with 1.4 billion AR user devices actively in use.
- When we look to the future, there is a significant expected surge. With predictions indicating that this figure will soar to a remarkable 17.3 billion in 2024.
- In 2023, the adoption of AR and VR increased by 3.8% compared to the previous year. Reaching a penetration rate of 28.8%.
- While AR adoption shows signs of growth, it remains a technology used by a minority of Americans.
- Specifically, only 30% of Americans engage with AR.
- Within this group, a third of users (10%) use AR less than once a month.
- Among the remaining 20%, there is an equal distribution of usage. With some using it monthly, weekly, multiple times a week, and even daily.
(Source: ARtillery Intelligence, Statista)
User Adoption and Engagement
- Most consumers, precisely 55%, derive entertainment from shopping with AR.
- A recent study reveals that 32% of AR users engage with it simply because they have an affinity for it.
- Notably, 91.75% of Generation Z individuals express a strong interest in AR-based shopping. Focusing on AR furniture placement, capturing the attention of 94% of Gen Z.
- Regarding shopping habits, 70% of shoppers believe that AR apps could influence how often they shop.
- Furthermore, 70% of consumers see AR as a valuable tool for acquiring new skills.
- In the workplace, according to 72% of US consumers, improved collaboration ranks among the top four advantages of using AR.
- The impact of AR on brand perception is also significant. 57% of users are more inclined to support brands that offer AR experiences.
- Moreover, 64% of customers feel that AR usage enhances their loyalty to a brand.
- Looking toward the future, over two-thirds of US residents anticipate AR becoming a routine aspect of daily life in the coming years. With 82% expressing their intent to use AR and VR more frequently.
(Source: WARC)
AR Devices and Hardware
AR-Hardware Market Size by Augmented Reality Statistics
- The AR Hardware industry is poised for significant revenue growth, with approximately US$2.36 billion expected in 2023.
- This growth is projected to continue at an impressive annual rate of 40.13% from 2023 through 2027. Ultimately resulting in a market size of roughly US$9.10 billion by 2027.
- The United States is anticipated to lead in revenue generation, with an estimated market volume of US$868.50 million in 2023.
- Regarding user adoption, it is predicted that the AR Hardware market will increase to approximately 106.6 million users by 2027.
- User penetration will start at 0.3% in 2023 and rise to 1.3% by 2027.
- The average revenue per user (ARPU) is around US$103.40.
AR Hardware Devices and Manufacturers
- Mobile AR, or Mobile Augmented Reality, integrates digital elements and context into the physical world using smartphones and tablets. It utilizes device cameras, sensors, and advanced computer vision.
- Vuforia and Wikitude were early pioneers.
- The big turning point came in 2017 with Apple’s ARKit for iOS and, in 2018, Google’s ARCore for Android.
- Notable players in Mobile AR frameworks include Snap AR, Meta’s Spark AR, and 8th Wall (now part of Niantic).
- Smart glasses, also called video, camera, or audio glasses, are incorporated eyewear types.
- Some notable examples of smart glasses include Google Glass, North Focals, Ray-Ban Stories, Echo Frames, and Snap Spectacles (versions 1 to 3).
- Instead of smart glasses, AR headsets precede crucial augmented reality capabilities such as spatial tracking and 3D environmental mapping rather than their external appearance.
- Two renowned instances of AR headsets include Microsoft Hololens and Magic Leap.
- However, The first Hololens was introduced in 2016, followed by the debut of Magic Leap 1 in 2018 and Hololens 2 in 2019.
- A more recent release, Magic Leap 2, became available in 2022.
(Source: Mixed Reality News)
Augmented Reality Statistics by AR Applications
AR in Gaming and Entertainment
- AR gaming stands out as the most preferred application of augmented reality. About 32% of Americans are interested in AR video games.
- 38% of users emphasize enhancing AR to create more captivating gameplay.
- On a global scale, a staggering 2.5 billion gamers worldwide collectively spent $152.1 billion on games during early 2020.
- What’s particularly noteworthy is that 35% of individuals who are not typically gamers show a keen interest in AR. A significant statistic given that 23% of consumers fall into the non-gamer category.
- Regarding AR gamers, a substantial 60% highlight the immersive experience as a pivotal factor driving their engagement with AR games.
- Intriguingly, one in three AR gamers believes that simply using a mobile device is insufficient for a genuinely fulfilling AR gaming experience.
- Moreover, Sports in AR also pique the interest of 43% of gamers, showcasing the versatility of AR applications.
- Furthermore, a quarter of consumers indicate their intention to utilize AR for exercise within the next five years.
- Among AR gamers, 40% agree that the enjoyment of AR gaming would increase with more immersive game offerings and access to more affordable AR glasses.
(Source: Statista)
Augmented Reality Statistics in Retail and E-commerce
- Global eCommerce data reveals that in 2020 the AR/VR market had an estimated value of $12.4 billion, with projections indicating an anticipated growth rate of 18.2% from 2022 to 2027.
- Breaking down the spending in 2020, consumer utility products accounted for the majority, comprising 52.9% of global AR/VR expenditure.
- Moving into 2021, the combined revenue from consumer and enterprise augmented reality glasses, including hardware and software, amounted to $1.85 billion.
- Projections foresee this figure surging to $3.78 billion in 2022 and an impressive $35.06 billion by 2026.
- Surveying global consumers to gauge their interest in augmented reality shopping experiences across generations, it’s apparent that Gen Z exhibits the highest enthusiasm for AR shopping.
- They are particularly eager to visualize furniture in their homes and experiment with new makeup or hair colors.
- Notably, in 2020, small and medium-sized enterprises emerged as dominant players in the Indian augmented reality market, claiming a substantial 62.92% share. This dominance is attributed to the agility of these businesses in implementing rapid changes.
- The virtual and augmented reality sector is expected to generate a significant 23 million jobs globally by 2030, spanning various industries. To put this into perspective, the sector provided 800,000 jobs in 2019.
- The global AR/VR market is poised for remarkable growth, with expectations of reaching a staggering $80 million by 2025.
(Source: Statista)
Augmented Reality Statistics Uses by Healthcare and Medicine
- The global market for augmented reality (AR) in the healthcare sector had an estimated worth of approximately $610 million in 2018.
- Projections indicate a substantial growth trend, with expectations that this market will surpass $4.2 billion by 2026. This data outlines the market’s size for augmented reality in healthcare in 2018 and provides a forecast for 2026.
- AccuVein’s AR technology has benefited over 10 million patients, increasing the likelihood of successfully locating a vein on the first attempt by 3.5 times through their AR app.
- St. Jude Research Hospital implemented EaseVRx, a VR platform employing goggles and headsets to create a captivating 3D environment.
- Following 6 months of usage, the hospital reported a remarkable 50% reduction in pain scores among patients.
- Additionally, they achieved significant monthly cost savings of $200,000 by reducing the purchase of pain-relieving medications.
(Source: Statista, Imaginovation.net, Softeq Development)
Augmented Reality Statistics by Manufacturing and Industrial Use
- The economic worth of augmented reality IoT in manufacturing is projected to be 40 to 50 billion U.S. dollars by 2025. It’s expected to experience further expansion, reaching approximately 90 to 110 billion U.S. dollars by 2030.
- This growth is driven by an increasing number of devices entering the market. Leading to an anticipated expansion in the user base for AR headsets in the years to come.
- Key industry players, including Apple and established AR glasses manufacturers like Microsoft, Magic Leap, and Nreal, are at the forefront of innovation. They are actively creating devices designed to facilitate the widespread adoption of AR across diverse industrial sectors.
- Additionally, Vuzix, a prominent American optical technology firm, is making significant strides in developing customized AR solutions for healthcare, manufacturing, and warehouse applications.
- There is growing interest in leveraging AR to enhance operational efficiencies within the manufacturing sector. According to Deloitte’s 2023 manufacturing industry outlook, 12% of surveyed manufacturers have expressed their intent to prioritize AR in the upcoming year to achieve these enhancements.
(Source: Statista, Deloitte)
AR/VR Platforms Receiving Attention From Game Developers
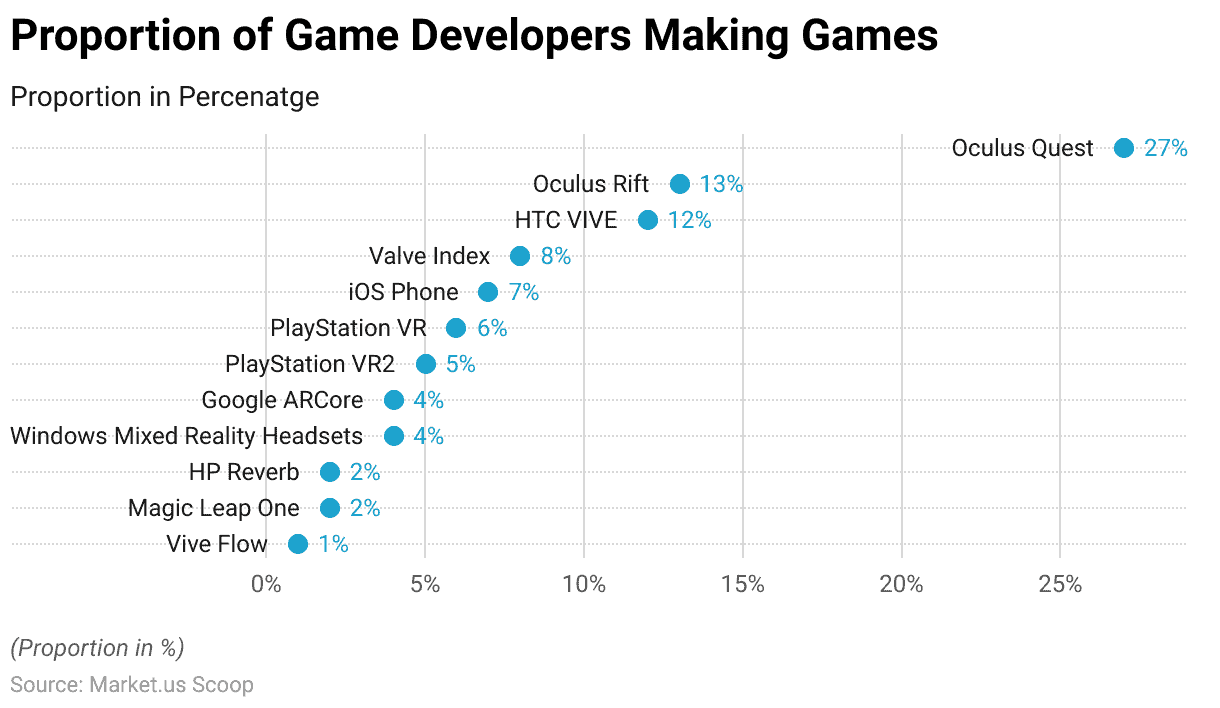
- The Oculus Quest takes the lead in augmented reality (AR) platforms and game development. With 27% of game developers actively creating games for this platform.
- Following closely behind, the Oculus Rift and HTC VIVE secure the second and third positions. With 13% and 12% of developers, respectively.
- The Valve Index holds the fourth spot, capturing the attention of 8% of game creators.
- However, iOS Phone and PlayStation VR follow closely, with 7% and 6% of developers working on these platforms.
- PlayStation VR2, Google ARCore, and Windows Mixed Reality Headsets share the next tier. Each attracts 5% or 4% of game developers.
- HP Reverb, Magic Leap One, and Vive Flow round out the list. Each garnered the attention of 2% or 1% of developers in the AR gaming landscape.
(Source: Game Developers Conference)
Augmented Reality Statistics by AR Glasses
- The revenue generated by AR glasses is on a remarkable trajectory, with projections indicating a substantial leap to over $35 billion by 2026.
- This growth trend is evident when we look at the breakdown of AR glasses revenue over the coming years. In 2021, the revenue stood at $1.85 billion, serving as the starting point for this surge.
- Moreover 2022, it is expected to soar to $3.78 billion, marking an impressive increase of $1.93 billion, or 104.3%, over the previous year.
- This momentum continues into 2023, with projected revenue of $6.77 billion, signifying an increase of $2.99 billion, or 79.1%, compared to the previous year.
- The trend persists in 2024, where revenue is estimated to reach $10.68 billion, reflecting a $3.91 billion increase, or 57.8%.
- The most substantial leap occurs in 2025, with projected revenue of $23.27 billion, indicating a staggering increase of $12.59 billion, or 117.9%.
- Finally, in 2026, the revenue is set to reach an impressive $35.06 billion, showcasing a substantial growth of $11.79 billion, or 50.7%.
(Source: ARtillery Intelligence)

Recent Developments
Acquisitions and Mergers:
- Snap Inc. acquires WaveOptics: In mid-2023, Snap Inc., the parent company of Snapchat, acquired WaveOptics for $500 million. WaveOptics is known for its AR display technology, and this acquisition aims to enhance Snap’s Spectacles with advanced AR capabilities.
- Facebook (Meta) acquires Scape Technologies: Facebook, now known as Meta, completed the acquisition of Scape Technologies for $400 million in late 2023. Scape Technologies specializes in computer vision-based localization technology, which will support Meta’s AR initiatives.
New Product Launches:
- Apple AR Glasses: Apple launched its long-awaited AR glasses, Apple Glass, in October 2023. These glasses provide real-time AR overlays, integrating seamlessly with iOS devices to enhance user experience with navigation, notifications, and interactive apps.
- Microsoft HoloLens 3: Microsoft released the HoloLens 3 in early 2024, featuring improved hand tracking, a wider field of view, and enhanced spatial sound, targeting enterprise and industrial applications.
Funding:
- Niantic raises $300 million: In 2023, Niantic, the developer behind Pokémon GO, raised $300 million to expand its AR platform and develop new AR experiences for mobile users.
- Magic Leap secures $500 million: Magic Leap secured $500 million in funding in early 2024 to further develop its AR technology and enhance its product offerings for both consumers and enterprises.
Technological Advancements:
- AI Integration in AR: The integration of AI with AR is advancing rapidly, with AI enhancing object recognition, real-time data processing, and personalized AR experiences, making interactions more intuitive and engaging.
- 5G-Enabled AR Experiences: The rollout of 5G networks is significantly enhancing AR experiences by providing low-latency and high-bandwidth connectivity, enabling more immersive and responsive AR applications.
Market Dynamics:
- Growth in AR Market: The global augmented reality market is expected to grow at a CAGR of 25% from 2023 to 2028, driven by increased adoption in gaming, healthcare, retail, and manufacturing sectors.
- Consumer and Enterprise Adoption: AR is seeing growing adoption among both consumers and enterprises. Consumers use AR for gaming and social media, while enterprises leverage AR for training, remote assistance, and product visualization.
Regulatory and Strategic Developments:
- Privacy Concerns and Regulations: As AR technology becomes more pervasive, there are increasing concerns about privacy and data security. Regulatory bodies are working on guidelines to ensure that AR applications protect user data and comply with privacy laws.
- Standardization Efforts: Industry groups are collaborating to create standards for AR technologies, aiming to ensure interoperability and enhance the development of AR applications across different platforms and devices.
Research and Development:
- Advanced AR Displays: Researchers are focusing on developing advanced AR displays, such as holographic and light-field displays, to create more realistic and immersive AR experiences.
- Spatial Computing: R&D efforts in spatial computing are enhancing the ability of AR systems to understand and interact with the physical environment, improving the accuracy and usability of AR applications.
Conclusion
Augmented Reality Statistics – Augmented Reality (AR) is experiencing rapid market growth across diverse industries, with a robust compound annual growth rate (CAGR) and a burgeoning market size.
The proliferation of mobile AR apps expanded its user base, while advancements in AR glasses and headsets enhanced hardware capabilities.
A thriving software ecosystem with innovative applications is evolving alongside growing AR developer communities.
Investments and acquisitions in AR startups indicated confidence in the technology’s potential, although challenges like technological hurdles and privacy concerns persisted.
Positive user engagement and applications in marketing, education, healthcare, and gaming showcased AR’s versatility.
With a promising outlook for its integration into daily life and continued innovation in emerging technologies like the AR Cloud and intelligent cities.
FAQs
What is Augmented Reality (AR)?
AR is a technology that overlays digital information, such as images, videos, or 3D models, onto the real-world environment, typically viewed through a smartphone, tablet, or AR glasses.
Which industries are adopting AR technology?
AR technology finds applications in various industries, including healthcare, education, retail, entertainment, and manufacturing, to enhance user experiences and improve efficiency.
Which companies are leading in AR hardware development?
Tech giants like Apple, Google, Microsoft, and Facebook (now Meta) actively invested in AR hardware development, including AR glasses and headsets.
What are the main challenges facing AR technology?
Challenges include technological limitations, privacy concerns, ethical considerations related to AR, and the need for further standardization.
How diverse are the demographics of AR users?
The demographics of AR users are diverse, ranging from younger generations to older users, depending on the specific application or platform.
Discuss your needs with our analyst
Please share your requirements with more details so our analyst can check if they can solve your problem(s)