


Digital Marketing Statistics – Nobody has failed to notice the digital revolution, whether they are a new business or an established one.
Some individuals saw digital marketing as just a fleeting craze. The company has been taken over by it, surpassing our wildest expectations in all aspects.
Businesses cannot do without the crucial contribution of the digital world. Although traditional advertising was once the primary sales source for businesses, this is no longer true.
The vast majority of businesses have completed the essential alterations, and those that haven’t will shortly fail.
Identifying which areas of your company necessitate more attention can be aided by understanding how other companies conduct themselves online.
Digital Marketing relies heavily on Email Marketing. $1 spent on Email Marketing results in an ROI of $36. Those returns are 36 times the original investment. Crazy right? Incorporate the below-mentioned statistics into your email marketing strategy planning.
Key Digital Marketing Statistics
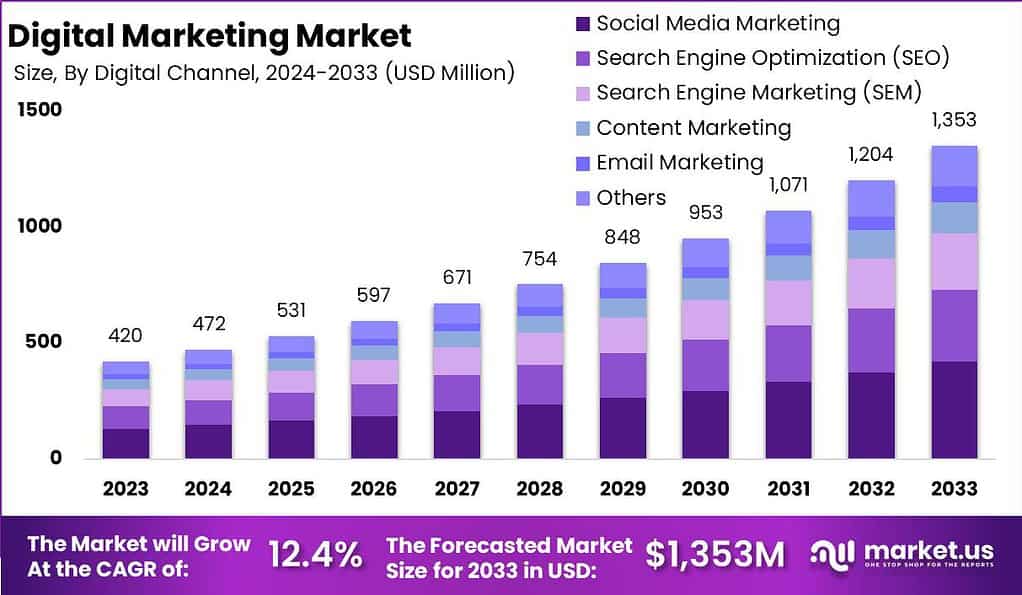
- Digital Marketing Market size is expected to be worth around USD 1,310.3 Billion by 2033, from USD 366.1 Billion in 2023.
- By the year 2023, digital advertising is anticipated to hit $602.25 billion.
- Search Advertising comprises the biggest segment, with a market volume of $202.40 billion.
- Expected to spend $232.7 billion on ads, the United States will be leading globally.
- The expected mean expenditure on social media advertising by every user in 2023, is $45.11.
- The proportion of smartphone-related advertising expenses is predicted to be 69% by 2026.
- The projected estimate for programmatic advertising contribution to digital advertising revenue is around 87% by the year 2026.
- A projection of 17 compound annual growth is expected for digital marketing. There will be a 6% decrease between 2021-2026.
- By 2023, social media advertising will exceed $230 billion.
- Facebook and Google Ads have the highest ROI rate in paid advertising.
- Digital advertising spending in 2021 was $436 billion US dollars. Traditional advertising was at $196 billion.
(Source: Statista, WordStream)
Social Media Marketing Statistics
- The average American adult spends more than two hours each day on social media.
- 91% of users use a mobile device to visit social media sites. This means you should integrate social media into your mobile marketing plan.
- Almost half of social media users rely on influencer brand recommendations. Check out our influencer marketing analysis to learn how to capitalize on this trend.
- Because Facebook video advertisements are used by less than 5% of businesses, this is a huge potential for firms trying to stand out.
- On Instagram, 90% of users follow at least one business.
- Twitter is used by more than 80% of B2B organizations for organic social media marketing and Twitter ads.
- Snapchat has 265 million daily active users who open the app more than 30 times every day.
- Snapchat users are more inclined to purchase goods or services using their mobile devices. They are also 60% more inclined to buy on impulse.
- The average swipe-up rate for Snapchat advertising is 50%, with a cost per swipe ranging from $.30 to $1.00.
General Digital Marketing Statistics
- In 2026, the Digital Marketing industry is set to achieve $807 billion.
- The ad spending share allocates 39% to desktop usage. Smartphones account for the remaining 61%.
- The majority of ad spending share, which is expected to be around 69%, will go to mobile phones in 2026 while desktops will only account for 31%.
- The year 2023 sees programmatic ad spending taking up 84% of the share, leaving non-programmatic ad spending with an insignificant 16%.
- Organic research offers the best ROI according to 49% of marketers.
- The number of leads generated is how 20% of businesses determine the success of Digital Marketing.
- Survey revealed that Digital Marketing gets 72% of the marketing budget.
- Google processes 8. As of 2023, there will be 5 billion searches every day.
- Google caters to a whopping 92% of global searches and is, therefore, the biggest search engine worldwide.
- According to a survey carried out by the Bureau of Labor, there will be an increase in demand for marketing jobs by up to 10% until 2026.
- Responding to reviews at regular intervals can help businesses increase customer spending by 50%.
- Over 90% of individuals check out online reviews before deciding to buy anything.
- All marketers use 62% of software for managing customer relationships.

(Sources: TechJury, Statista, Wikipedia, Bureau of Labor, WordStream, Hubspot)
Email Marketing Statistics
- 14 billion individuals will use email every day in 2023.
- Email marketing can return $36 for every dollar spent.
- There are 319 people in the world. Six emails will be sent per day in 2023.
- Every day, smartphone users open more than one-third (36.6%) of their emails.
- Only one-fifth of marketing email campaigns are optimized for mobile devices.
- Email marketing yields $8 in revenue. The total amount will be 49 billion by 2023.
- Mondays have the greatest opening rate, with an amazing 22%. Meanwhile, Sundays come in last place with a disappointing 20.3% share.
- On Tuesdays, click-through rates peak at 2.4%. Saturdays and Sundays have a CTR of only 2.1%, whereas other days had rates of 4% and 1%, respectively.
- Marketers utilizing email marketing globally (82%), those using automated emails account for the vast majority, accounting for 65%.
- Almost 70% of email users can tell if an email is spam mail based solely on the subject line.
- When an emoji is used in the subject line of an email instead of plain text, the conversion rate jumps by 56%.
- Approximately half of all brands use videos in their email marketing campaigns.
- Generally, approximately 70% of an email’s receivers can discern whether it may be spam just by examining the headline.
- The conversion rate increases drastically at 56% if a single Emoji is included in the message headline as opposed to ordinary text.
- On a universal level, advertising emails have an opening rate of 18%, along with a CTR (click-through rate) of 2.6% and a CTOR (click-to-open rate) totaling 14.1%.
- The approach that global marketing emails utilize usually accumulates a quit rate of 0.1%.
- Consumers dedicate an average interval of 10 seconds to perusing brand emails.
- 46% favor communications for their brands through sending electronic mail.
E-Commerce Statistics
The e-commerce sector has been an absolute behemoth over the past decade and the Covid-19 pandemic hasn’t done anything to stymie its growth.
With the E-commerce industry currently worth close to $4.9 billion, these E-commerce Statistics are essential to incorporate into your Digital Marketing Strategy.
- Rough 27% of the global population (2.14 billion people) shop online regularly.
- Perhaps even more staggeringly, as much as 69% of all eCommerce web traffic derives from organic sources such as Google.
- 60% of Millennials make Amazon.com their first port of call when looking to buy something via the Internet.
- Besides that, product reviews from family and friends tend to be respected and trusted by 80% of buyers in most cases.
- Additionally, the average E-commerce website conversion rate generates up to 2.90%.
- Bona fide leader of the pack, Shopify boasts 5.6 million sites out of 24 million globally.
- 64.7% of customers usually prefer making purchases from websites that present content in their native language.
- The CRO strategy is not employed by an appalling 68% of small-scale businesses.
(Sources: Demandsage)
Mobile Commerce in Digital Marketing Statistics
Mobile e-commerce contributes significantly to retail e-commerce sales, accounting for an incredible $3.4 trillion. Smartphones have become the preferred device for most online activities because of their simplicity and widespread availability, stressing the need to tailor marketing efforts for mobile phones. Smartphones account for an astounding 70% of eCommerce visitors.
- 93% of millennials use cell phones to compare internet prices.
- 53% like to use preferred business software when shopping.
- A stunning 65% of people use portable devices to browse possibilities in real establishments.
- Smartphone use results in $3.4 trillion in online retail e-commerce goods sales.
- When loading times increase from 1 to 3 seconds, bounce rates on m-commerce sites increase by 32%.
- 32% of shoppers research comparable goods online before making a purchase choice in-store.
- Mobile application conversion rates are three times greater than mobile website conversion rates.
- The vast majority (more than 70%) of e-buyers favor well-optimized websites that provide seamless user experiences.
- When rendered an unsatisfactory digital experience, 62% of shoppers are unlikely to buy again from the website.
- Incorporating Call to Action buttons boosts clicks notably by 45%.
- 61% lean towards patronizing mobile websites that accommodate useful filters.
(Sources: Demandsage)
SEO Statistics
SEO is an essential part of any Digital Marketing work. Even if excellent leads are generated through advertising, conversions will not occur until the user experience on the website is satisfactory. SEO covers a wide range of topics. Refer to the statistics provided below to grasp its significance.
- By 2023, the SEO industry will be worth more than $50 billion.
- Organic traffic is responsible for 53% of overall website traffic.
- Brands that have a dedicated blog get 55% more traffic than those that do not.
- 75% of users never scroll past the first page of Google results.
- Leads generated by SEO have a 15% close rate.
- The top page of Google search results has a click rate of 32% on average.
- The first page’s average word count is 1500.
- Almost half of businesses think SEO is their top revenue driver.
- 98% of customers ignore paid advertisements.
- Smartphones account for more than half of all internet traffic (55%).
Social Media Marketing Statistics
Social Media Marketing, or SMM, is a significant part of Digital Marketing. The consumption of short-form videos on social media is increasing. In this section, we’ll look at data from several social media networks.
- The social media marketing sector is valued at $160 billion and is predicted to increase to $223 billion by 2023.
- There are over 4.26 billion social media users in the world.
- Businesses spend around 15% of their marketing budget on social media marketing.
- More than 90% of brands employ social media marketing.
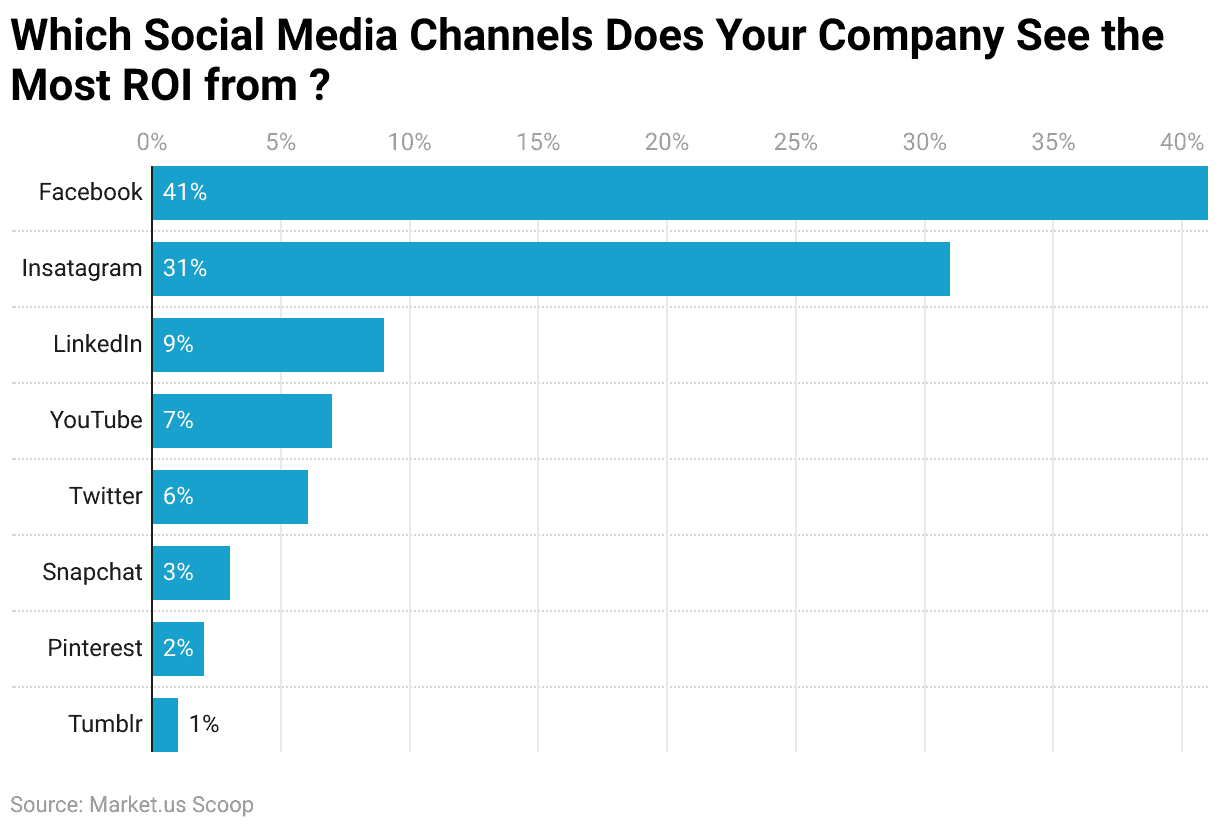
- Facebook advertising is the world’s most popular ad program.
- Nearly 86% of businesses use Facebook’s advertising platform.
- TikTok is the most rapidly developing social media network.
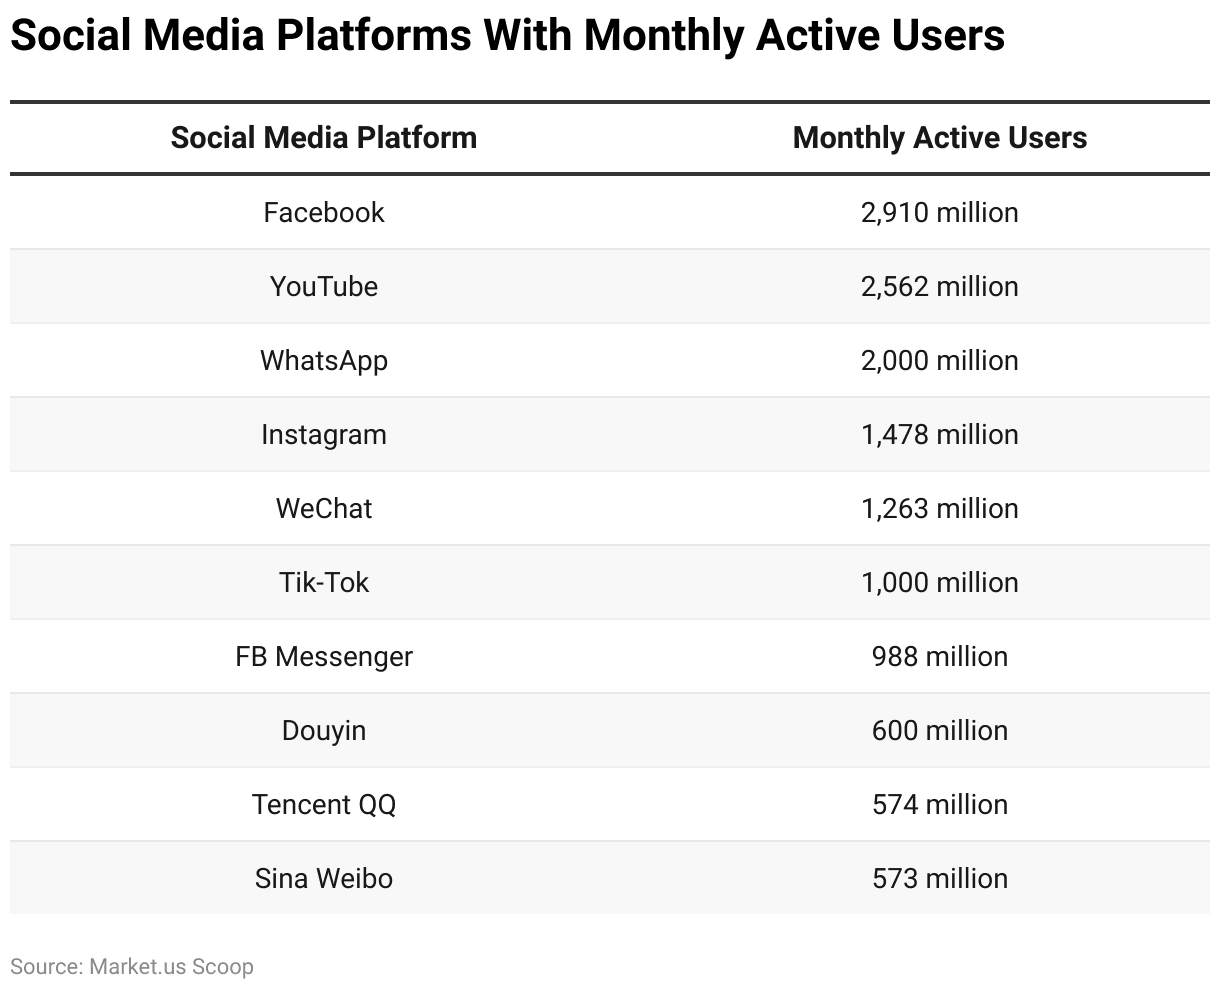
- Here is a list of the top social media sites in 2023.
(Sources: DemandSage, Meta, Bytedance, WordStream, TikTok, Wikipedia, Bloomberg, Influencer marketing hub, The Verge, NY Times)
Social Media Platform-Specific Statistics
Facebook Statistics
- Facebook has 2.9 billion monthly active users and 1.9 billion daily active users. It is the world’s most popular social media site.
- 37% of the world’s population uses Facebook.
- India has the most Facebook users, with over 330 million members.
- South Asia has the most Facebook users (456.8+ million).
- Males make up 56.8% of Facebook users, while females make up 43.2%.
- Facebook has a total ad reach of 2.14 billion people.
- 27% of the world’s population sees Facebook advertising.
- Facebook ad visitors are 31 years old on average.
- With over 643 million members, the majority of Facebook’s audience is between the ages of 25 and 34.
- Mobile phones are used by over 98% of Facebook’s audience to access the platform.
(Source: Meta, DemandSage, Detareportal)
Instagram Statistics
- Instagram has over 500 million daily active users and a monthly active user base of 2 billion.
- Instagram’s readership is 50.7% male and 49.3% female.
- Instagram’s story feature is used by 3. 2 billion users each month.
- With 2 billion monthly active users, Instagram is the fourth most popular social media site.
- Instagram is reported to have around 95 million (9.5%) bot accounts.
- India has the highest number of Instagram users (230.25 million).
- The average Instagram user logs in for 30 minutes.
- Cristiano Ronaldo is the most followed person on Instagram, with 457 million followers.
(Source: DemandSage)
Tik-Tok Statistics
- TikTok is the world’s sixth most popular social network, with 1 billion MAUs.
- Females account for 57% of TikTok users, while males account for 43%.
- TikTok is expected to have 1.5 billion MAUs by the beginning of 2023.
- TikTok is used by 20.83% of all internet users worldwide.
- Every day, over 1 billion videos are viewed on the platform.
- TikTok has an 885 million ad reach.
(Source: DemandSage)
YouTube Statistics
- As of 2023, YouTube has over 2.5 billion monthly active users.
- YouTube is the world’s most popular video-sharing website and the second most popular social media network.
- 52% of internet users worldwide visit YouTube at least once a month.
- Every day, over 122 million users visit YouTube’s websites and apps.
- India has the most YouTube subscribers (467 million).
- Males make up 53.9% of YouTube’s audience. Females make up 46.1% of the entire audience.
- One billion hours of video are watched on YouTube every day.
- The average YouTube user is between the ages of 25 and 34.
- YouTube is the second most popular social media platform for influencers. Instagram takes the lead.
(Source: DemandSage)
Influencer Marketing Statistics
- The influencer market is worth $14 billion.
- Influencer marketing has a 650% return on investment, with marketers gaining $6.5 for every dollar invested.
- Influencer marketing has exceeded print advertising in terms of efficacy.
- Nearly 56% of marketers in the United States and the United Kingdom use Instagram to collaborate with influencers.
- Micro-influencers are preferred by marketers over mega-influencers.
- By 2028, the influencer marketing industry will be valued at $85 billion.
(Source: DemandSage)
Future Of Digital Marketing Statistics
- It is estimated that smartphones would contribute 69% of total advertising spending. Make sure your social media initiatives are optimized for smartphones!
- One statistic also shows that 90% of mobile users are unsure of what they want to buy, so they hunt for it online. Make sure your digital marketing initiatives are optimized for the ever-increasing mobile consumers.
- According to the Marketing Insider organization, more than half of digital marketers will boost their content marketing budget in 2023.
- Augmented reality is the next big thing in marketing. According to the industry, the global augmented reality industry will be worth $461.25 billion by 2030. These projections are based on the sector’s CAGR of 41.50%.
- 61% of buyers prefer to shop at businesses that offer augmented reality.
- Another factor to consider is voice search. According to Google, more than half of baby boomers use voice assistants to access information on the go.
(Source: DemandSage)
Digital Marketing Trends Statistics
- Mobile-first approach.
- Augmented reality.
- Voice search.
- Use of AI
- Influencer marketing, especially using micro-influencers.
- All social media platforms, including LinkedIn, will be dominated by video content.
Recent Developments
Acquisitions and Mergers:
- Accenture has completed the acquisition of Work & Co, enhancing its capabilities in digital product creation and transforming customer experiences. This move strengthens Accenture’s position in delivering high-quality digital experiences across various platforms.
New Product Launches and Trends:
- The shift towards a cookieless future is accelerating, with Google planning to phase out third-party cookies in Chrome by the second half of 2024. This significant change is prompting marketers to adopt new approaches for media attribution and effectiveness.
- The importance of content marketing continues to grow, with a focus on creating content that reflects a brand’s values. This strategy is increasingly important for customer retention and aligning with consumer expectations.
Market Trends:
- There has been a notable increase in the use of short-form video content on platforms like TikTok, Reels, and YouTube Shorts, as these align well with the fast-paced attention spans of contemporary audiences. This trend is partly driven by its cost-effectiveness and the high engagement rates it offers.
- Investment in native advertising is expected to either increase or remain stable for the majority of marketers. This form of advertising is favored for its ability to blend seamlessly with the host content, providing a less intrusive advertising experience.
Conclusion
Digital Marketing Statistics – Advertising has been evolving in the age of technology, with a transition towards digital platforms.
By 2023, it is predicted that digital ad spending will surge to a mind-boggling $602.25 billion, with search advertising leading the charge at $202.40 billion.
The biggest spender will likely be the United States, which is estimated to dish out a staggering $232.7 billion.
Alongside this, social media advertising is projected to continue its rise, exceeding $230 billion by 2023, averaging $45.11 per user. To stay ahead in the ever-changing market, companies must adjust to the digital age, where advertising is the way of the future.
Frequently Asked Questions
How big is the digital marketing industry?
According to digital marketing statistics, By the year 2023, digital advertising is anticipated to hit $602.25 billion.
What is the success rate of digital marketing?
While it is difficult to define what we mean by digital marketing success rate, it has been reported that businesses can earn $44 for every dollar spent on email marketing on average. (Source: Marketing Insider Group)
Is digital marketing more effective than traditional marketing?
Digital marketing is unquestionably less expensive than traditional marketing, and it also has a slew of other advantages, which we outline here. You will be the best judge of what works best for you among traditional and digital marketing based on your circumstances and business. (Source: LYFE Marketing)
Discuss your needs with our analyst
Please share your requirements with more details so our analyst can check if they can solve your problem(s)