


Introduction
Electric Vehicle Statistics: An electric vehicle, sometimes known as an EV. It is a type of vehicle that is propelled by one or more electric motors or traction motors.
Unlike classic ICE vehicles that run on gasoline or diesel. Electric vehicles (EVs) are powered by energy stored in batteries or supplied by an external power source.
The primary energy source for EVs is electricity, converted into mechanical energy to drive the vehicle. Different types of electric vehicles cater to various needs and preferences. Offering options for emissions reduction, energy efficiency, and varying ranges.
As technology advances, the electric vehicle landscape evolves, with more models and variations becoming available to consumers.
Editor’s Choice
- The Global Electric Scooter and Motorcycle Market size is expected to be worth around USD 197.1 Billion by 2033, From USD 35.8 Billion by 2023. Growing at a CAGR of 18.60% during the forecast period from 2024 to 2033.
- In 2020, global electric vehicle sales reached approximately 3.1 million units, accounting for about 4.4% of global passenger car sales.
- China has been a significant driver of EV adoption, with over 1.3 million EVs sold in 2020. Europe has also seen rapid growth, with countries like Norway having a particularly high EV market share.
- The Tesla Model 3 was one of the best-selling EVs globally. Followed by models like the Renault Zoe, Nissan Leaf, and Volkswagen ID.3.
- As of 2021, some European countries saw EV market shares exceeding 10% of total new car sales. Norway, for example, had over 54% EV market share in 2020.
- There were around 862,118 public charging points worldwide in 2020, with China, Europe, and North America having the largest share.
- The cost of EV batteries has been decreasing steadily. In 2020, the average price of a lithium-ion battery pack fell to around $137 per kWh, a significant reduction from previous years.
- The average range of affordable EVs has been increasing. In 2021, several models offered ranges of over 200 miles (320 kilometers) on a single charge.
Global Electric Vehicle Market Size
- The global electric vehicle (EV) market has witnessed remarkable growth in recent years, as evidenced by revenue figures. In 2018, the industry generated approximately $112.9 billion in revenue, which continued to rise steadily in subsequent years.
- By 2019, the revenue had increased to $121.5 billion, indicating a growing interest in and adoption of electric vehicles. However, it was in 2020 that the industry experienced a substantial leap, with revenues reaching $176.1 billion. Showcasing a significant acceleration in EV adoption and market expansion.
- The momentum continued into 2021, a pivotal year for electric vehicles. As the industry revenue skyrocketed to a staggering $352 billion. This dramatic increase highlighted the evolving consumer preferences towards cleaner and more sustainable transportation options.
- The growth trajectory persisted as 2022 saw the revenue climb even higher. Reaching an impressive $538.8 billion, underscoring the continued popularity of EVs.
- The upward trajectory of the electric vehicle industry continued into 2023, with projected revenues of $561.4 billion. Reinforcing the sustained demand for electric vehicles across global markets.
- As the year progresses, the industry is expected to maintain its upward trend. With revenue estimations of $623.4 billion in 2024 and $687.8 billion in 2025. This growth is indicative of the ongoing shift towards electric mobility solutions and the advancements in EV technology.
- Looking ahead, the electric vehicle industry’s revenue is anticipated to reach $744.7 billion by 2026 and $812.5 billion by 2027. Underlining the transformative impact of electric vehicles on the automotive sector.
- By 2028, the revenue is projected to surge to $906.7 billion, underscoring the sustained growth and potential economic significance of electric vehicles on a global scale. This dynamic growth trajectory reflects changing consumer preferences and the collective commitment towards reducing carbon emissions and embracing a cleaner transportation future.
(Source: Statista)

Global Electric Vehicles Market Size by Segment
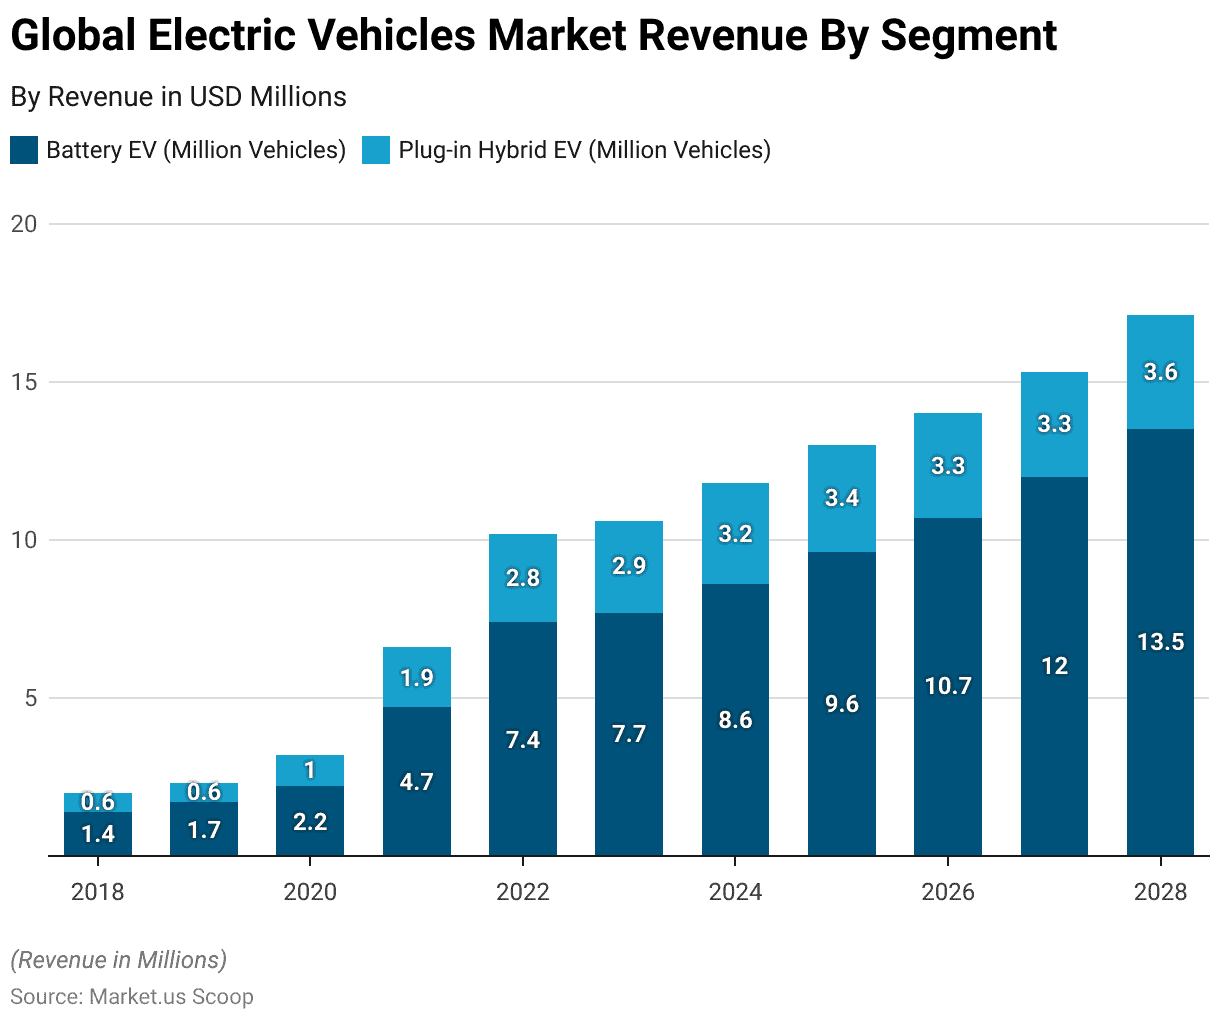
- The electric vehicle market has exhibited a remarkable evolution across different segments. With the adoption of battery electric vehicles (BEVs) and plug-in hybrid electric vehicles (PHEVs) gaining significant traction. In 2018, BEVs comprised 1.4 million vehicles globally, marking the beginning of a transformative trend.
- The subsequent year saw a notable increase, with BEV numbers rising to 1.7 million. This growth accelerated in 2020, reaching 2.2 million BEVs as consumer interest in emission-free mobility intensified.
- The pivotal year of 2021 witnessed a remarkable surge, as the number of BEVs on the road skyrocketed to 4.7 million. Indicating a substantial shift towards electrified transportation. The momentum continued into 2022, with 7.4 million BEVs contributing to reduced environmental impact and increased sustainable mobility solutions.
- As 2023 progressed, the adoption of BEVs remained robust, with the global count reaching 7.7 million.
More Insights
- Looking ahead, the trajectory of BEV adoption is expected to maintain its upward trend. With projected numbers of 8.6 million in 2024 and 9.6 million in 2025.
- As the technology and infrastructure continue to improve, the number of BEVs is anticipated to reach 10.7 million by 2026 and expand to 12 million in 2027. Demonstrating the relentless commitment to electric mobility.
- By 2028, the number of BEVs is projected to reach an impressive 13.5 million. Underscoring the industry’s collective dedication to a cleaner transportation landscape.
- In parallel, the plug-in hybrid electric vehicles (PHEVs) market has also seen consistent growth. 2018 there were 0.6 million PHEVs, which remained steady in 2019. However, by 2020, this figure rose to 1 million PHEVs, signifying a growing interest in vehicles offering both electric and combustion engine capabilities.
- The popularity of PHEVs continued to increase, reaching 1.9 million in 2021 and further expanding to 2.8 million in 2022.
- As the transition towards electrified transportation continues, PHEVs will remain relevant, with an estimated 3.6 million on the road by 2028.
(Source: Statista)
Electric Vehicle Statistics by Region
United States Electric Vehicle Market Statistics
- In 2022, the electric vehicle (EV) sector in the United States achieved unprecedented milestones, with sales of nearly 918,500 light electric vehicles.
- This figure represented more than two and a half times the sales recorded in 2018. A pivotal year when the surge in demand for Tesla’s Model 3 commenced. This sedan is one of the most popular electric vehicles in the U.S. market.
- Despite new entrants striving for profitability, Tesla continues to assert its dominance with an estimated 536,100 electric vehicle sales in the U.S. in 2022.
- However, the competitive landscape is gaining momentum as manufacturers like General Motors introduce fresh electric models to their vehicle portfolios.
- Prominent additions like Ford’s Mustang Mach-E and Chevrolet’s Bolt attained positions among the top-selling electric vehicle models in 2022.
- The Chevrolet Bolt achieved sales of approximately 20,800 units in 2020 and 22,100 units in 2021 within the United States. Manufactured by a subsidiary of General Motors, the production of the Bolt model is set to end by the conclusion of 2023. With a shift in focus toward producing electric pickup trucks.
- Sales of the Chevrolet Bolt dropped in 2022 to levels last seen in 2017. General Motors envisions offering only zero-emission vehicles by 2035 as a forward-looking strategy.
(Source: Statista)
China Electric Vehicle Market Statistics
- China is recognized as the leading electric vehicle (EV) manufacturer. Produced a substantial 3.5 million EVs in 2021, marking a remarkable 1.6-fold increase compared to the previous year.
- Impressively, revenues generated from the EV market in the same year amounted to around $102.2 billion, establishing a record within the Asia-Pacific region.
- The preference for battery electric vehicles (BEVs) outshone plug-in hybrid electric vehicles (PHEVs), with sales of 2.9 million BEVs and 600,000 PHEVs in 2021. This trend saw BEVs capturing a significant 10.9% market share in China. Poised to rise even further in the upcoming years. The allure behind promoting BEVs in China is their capacity to eliminate dependence on oil consumption, emit zero CO2 emissions, and produce minimal noise.
- Adding to the appeal of BEVs is China’s expanding network of EV charging infrastructure. By 2021, the count of public and private EV charging stations will reach nearly 1.2 million and 1.5 million, respectively, solidifying the convenience and feasibility of BEVs.
(Source: Statista)
Europe Electric Vehicle Market Statistics
- Anticipated data indicates that the Europe Electric Vehicles market is set to achieve a revenue milestone of approximately $164.0 billion in 2023.
- Forecasts predict a consistent annual growth rate (CAGR 2023-2028) of 11.99%, leading to a projected market size of around $288.9 billion by 2028.
- The sales of Electric Vehicles in Europe are expected to culminate in 4.8 million units by 2028.
- Furthermore, the price dynamics within the Electric Vehicles market are projected to follow a volume-weighted average of $60,000 in 2023.
- Norway is the European leader in adopting plug-in electric vehicles (PEVs). Despite being among the smaller car markets in the European free trade sector, Norway registered approximately 141,400 passenger car sales from January to December 2020.
- Notably, 2020 saw the registration of around 105,000 plug-in electric cars. Among the prominent car brands in Norway, the American all-electric manufacturer Tesla holds a significant presence. This surge in electric mobility within Norway can be attributed to the exemption of high car import duties and registration taxes for electric vehicles, making them comparatively more affordable than traditional combustion engine cars.
- By 2020, the number of electric passenger cars on Norwegian roads had surpassed 450,000.
- 2021 marked a milestone for electric vehicle sales across Europe, with the Tesla Model 3 emerging as the top-selling electric model.
- While European automakers had initially been slow to enter the EV market, they are now swiftly establishing themselves as major contenders.
- Germany’s Volkswagen, for instance, had two of its models leading European EV sales and nearly doubled its global electric vehicle sales from 2020 to 2021.
- Additionally, foreign manufacturers like Tesla and Nissan continue to perform strongly in this evolving landscape.
(Source: Statista)

Electric Vehicle Key Players Statistics
- Throughout the quarters spanning from Q2 2021 to Q1 2023, notable shifts in market share among different automotive brands have been observed. BYD Auto, for instance, started at 7% in Q2 2021 and progressively gained traction, reaching 21% by Q1 2023.
- Similarly, Tesla maintained a relatively consistent presence, hovering between 12% and 16% during this period.
- In contrast, Volkswagen witnessed a slight decline in market share, moving from 14% in Q2 2021 to 7% in Q1 2023.
- The combined share of other brands remained predominant, ranging from 56% to 64% over the quarters, showing a degree of stability amid these fluctuations.
- From 2015 to 2021, Tesla’s annual turnover witnessed remarkable growth for seven years, reflecting a series of substantial leaps. Starting at 4.046 billion in 2015, the turnover surged by 26.52% in the following year, reaching 7 billion in 2016.
- This upward momentum continued with a staggering 73.01% increase in 2016, pushing the turnover to 11.759 billion.
- The subsequent years witnessed consistent expansion, as the turnover soared by 67.99% in 2017, 82.51% in 2018, and 14.52% in 2019, culminating in an impressive total of 24.578 billion.
- The growth trajectory persisted into 2020, with a substantial 28.31% increase, bringing the annual turnover to 31.536 billion.
- The pinnacle of this remarkable journey was reached in 2021. As the turnover surged to a remarkable 53.825 billion, representing a phenomenal 70.67% increase.
(Source: Counterpoint Research, Tesla)

Electric Vehicle Statistics by Charging Infrastructure
Slow chargers
- On a global scale, over 600,000 public slow-charging points were added in 2022, with China contributing 360,000 to this total. Resulting in a cumulative count of more than 1 million slow chargers in the country by the end of the year.
- Consequently, China accounted for over 50% of the worldwide stock of public slow chargers by the close of 2022.
- In Europe, the second-largest contributor, the tally of slow chargers reached 460,000 in 2022, indicating a notable 50% increase from the preceding year.
- The Netherlands claimed the leading position in Europe with 117,000 slow chargers. Trailed by France with approximately 74,000 and Germany with around 64,000.
- Meanwhile, the United States saw a modest 9% growth in slow-charging stock in 2022. The slowest expansion rate among prominent markets.
- Remarkably, Korea displayed a doubled year-on-year growth in slow charging points, culminating in a total of 184,000 charging points.
(Source: International Energy Agency)
Fast chargers
- In 2022, there was a global increase of 330,000 fast chargers, with China contributing most of this growth, accounting for nearly 90%. The expansion of fast charging infrastructure serves as a solution for the absence of home chargers in densely populated urban areas. It aligns with China’s ambitions for swift electric vehicle adoption.
- Notably, China boasts 760,000 fast chargers, although more than 70% of the public fast charging stations are concentrated within only ten provinces.
- Within Europe, the cumulative count of fast chargers reached upwards of 70,000 by the conclusion of 2022, marking a growth of approximately 55% compared to 2021.
- Countries like Germany, with over 12,000 units leading in fast charger deployment, France with around 9,700, and Norway with about 9,000.
- In 2022, the United States set up 6,300 fast chargers, with Tesla Superchargers accounting for approximately 75%.
- By the close of 2022, the country’s overall number of fast chargers reached 28,000.
(Source: International Energy Agency)
Electric Vehicle Statistics by Battery Demand
- In 2022, there was a significant surge in demand for automotive lithium-ion (Li-ion) batteries, reaching 550 GWh, marking a substantial 65% increase compared to the 330 GWh recorded in 2021.
- This remarkable growth can be largely attributed to the expanding sales of electric passenger cars, which saw new registrations skyrocket by 55% in 2022 compared to the previous year.
- China, a prominent player in this trend, experienced an impressive 70% surge in vehicle battery demand.
- This was in tandem with an 80% upsurge in electric car sales in 2022 instead of 2021. Although the growth in battery demand was slightly moderated by a rising proportion of plug-in hybrid electric vehicles (PHEVs), the overall trajectory remained robust.
- In the United States, automotive battery demand exhibited an approximately 80% increase, even though the rise in electric car sales was around 55% in 2022.
- It’s worth noting that the average battery size for battery electric cars in the United States expanded by approximately 7% during the year. It remained notably 40% higher than the global average. This discrepancy can be attributed partially to the higher prevalence of SUVs in the U.S. electric car market compared to other major markets and manufacturers’ deliberate strategies to provide extended all-electric driving ranges.
(Source: International Energy Agency)

Gasoline vs. Electric Vehicle Statistics
- The comparison between normal gas and electric vehicles regarding kilometers covered reveals interesting insights. For a distance of 50,000 kilometers, normal gas vehicles emit CO2 of 17 units, whereas electric vehicles emit 11.2 units.
- When the distance extends to 100,000 kilometers, CO2 emissions stand at 27.7 units, whereas electric vehicles improve to 13.2 units.
- This trend continues, with gas vehicles emitting 38.9 units for 150,000 kilometers, while electric vehicles emit 14.9 units.
- Upon reaching 200,000 kilometers, gas vehicles record an emission of 49 units, and electric vehicles demonstrate an emission of 16.3 units. The data underscores the progressive advantage of electric vehicles in terms of CO2 emission as the distance covered increases.
(Source: European Federation for Transport and Environment)
Zero-Emission Vehicle Policies – Electric Vehicle Statistics
- In 2020, Canada remained committed to bolstering essential infrastructure and incentives for zero-emission vehicles (ZEVs). Driven by its heightened climate ambitions of achieving net-zero emissions by 2050.
- Canada established ZEV targets, aiming for 10% of light-duty vehicle (LDV) sales to be ZEVs by 2025, escalating to 30% by 2030, and ultimately reaching 100% by 2040.
- Québec, in particular, has shown a stronger drive for accelerated ZEV adoption, aligning its mandates with those of California and 14 other US states.
- Notably, British Columbia has also embraced a ZEV mandate and, in collaboration with Québec, is spearheading ZEV uptake nationwide. In a significant move, the federal government allocated CAD 1.5 billion (equivalent to USD 1.2 billion) in 2020 to the low-carbon and zero-emissions fuels fund. This investment aims to amplify the production and utilization of low-carbon fuels.
- In 2020, the United States took a comparatively less supportive stance towards electric vehicles (EVs) when compared to China and Europe.
- During that year, a federal tax credit of up to USD 7,500 remained available to purchase electric cars. However, this credit was an exception for General Motors and Tesla, as both automakers had already surpassed the sales limit of 200,000 units per manufacturer in 2018. Notably, the federal government chose not to renew this tax credit.
(Source: International Energy Agency)
Recent Developments
Acquisitions:
- Caterpillar’s Investment in Lithos Energy: In January 2023, Caterpillar announced an investment in Lithos Energy, a U.S.-based battery technology company specializing in lithium-ion battery packs. This investment aims to accelerate the development of Caterpillar’s electrified product portfolio and support the transition to lower-carbon technologies.
New Product Launches:
- Amazon Echo Pop: Amazon launched the Echo Pop smart speaker in June 2023, featuring a hemispherical design and enhanced voice assistant capabilities. This launch reflects Amazon’s continuous efforts to innovate within the smart home market.
- Volvo’s Electric Truck Range Expansion: In December 2022, Volvo Trucks announced the expansion of its electric truck range by introducing rigid versions of its heavy electric trucks, including the Volvo FH, Volvo FM, and Volvo FMX. This expansion aims to electrify more transport routes and reduce emissions.
Funding:
- GM’s Increased Investment in EVs and AVs: General Motors (GM) announced an increase in its EV and autonomous vehicle (AV) investments to $35 billion through 2025. This represents a 75% increase from its initial commitment, focusing on expanding EV production capacity and securing battery supply.
- UK Government’s £89 Million Investment in EV Technology: In October 2023, the UK government announced £89 million in joint funding with industry to develop cutting-edge net-zero technologies, including advancements in EV infrastructure and battery technology.
Market Growth:
- Global Market Expansion: The growth is driven by the increasing adoption of EVs, advancements in battery technology, and supportive government policies.
- US EV Sales Growth: In 2023, EV sales in the US crossed the one-million-unit mark for the first time, increasing by nearly 52% compared to 2022. This significant growth reflects the rising consumer demand for EVs despite challenges such as higher vehicle prices and interest rates.
Innovation and Trends:
- Integration with AI and IoT: Companies are integrating advanced AI and IoT technologies into EVs to enhance performance, safety, and user experience. This includes developments in autonomous driving capabilities and smart charging solutions.
- Affordable EV Models from Chinese OEMs: Chinese EV manufacturers are offering vehicles at competitive prices, which are sometimes lower than those of internal combustion engine vehicles. This price competitiveness is helping accelerate the global shift towards EVs.
Conclusion
Electric Vehicle Statistics – Electric vehicles (EVs) have experienced significant growth and transformation over the past decade. Numerous statistics highlight their increasing popularity and impact on the automotive industry and the environment.
The adoption of electric vehicles has been steadily increasing across the world. Countries like China, Europe, and the United States have been leading in EV adoption rates. With many EV models available to cater to different consumer preferences.
EV sales have grown rapidly yearly, taking a larger share of the overall automotive market. One of the primary reasons for the push towards EV adoption is their potential to reduce greenhouse gas emissions and air pollutants.
Expanding charging infrastructure has played a crucial role in encouraging EV adoption. Governments, private companies, and stakeholders have been investing in building charging stations. Including fast chargers to alleviate range anxiety and make EV ownership more convenient.
FAQs
Which countries lead in electric vehicle adoption?
China, Europe (particularly countries like Norway, the Netherlands, and Germany), and the United States were leading in EV adoption by 2021, with these regions offering supportive policies and incentives for EV buyers.
How have EV sales changed over the years?
EV sales have been on an upward trajectory, with substantial growth over the past few years. As battery costs decrease and consumer preferences shift toward cleaner transportation options, the trend has been toward increasing sales.
Are there statistics on the environmental benefits of electric vehicles?
Studies have shown that EVs emit fewer greenhouse gases and air pollutants than internal combustion engine vehicles. The exact emissions reduction varies depending on factors like the energy source for electricity generation.
What’s the status of the charging infrastructure for EVs?
Charging infrastructure has been expanding to support the growing number of EVs. Fast-charging stations have become more prevalent, reducing range anxiety for EV owners and making long trips more feasible.
Do governments offer incentives for electric vehicle buyers?
Many governments provide incentives to promote EV adoption, such as tax credits, rebates, and access to carpool lanes. These incentives vary by country and can significantly affect the purchase of an EV.
Discuss your needs with our analyst
Please share your requirements with more details so our analyst can check if they can solve your problem(s)