


Table of Contents
- Introduction
- Editor’s Choice
- Smart TV Statistics – Regional Market Analysis
- Worldwide Smart TV Shipments by Vendor
- Worldwide Smart TV Shipments by Operating System (OS) Statistics
- Smart TV Statistics – Penetration and Adoption
- Smart TV Statistics by Region
- Smart TV Statistics – Advertising and Monetization
- Smart TV Statistics – Regional Advertising and Monetization
- Recent Developments
- Conclusion
- FAQs
Introduction
Smart TV Statistics: A Smart TV is a television set that goes beyond. The traditional functionality of a standard TV by integrating internet connectivity and interactive features.
It allows users to access a wide range of online content, streaming services, apps, games, and other interactive services directly from their TV screen.
Smart TVs typically have built-in Wi-Fi or Ethernet connectivity. Enabling them to connect to the internet without the need for additional devices like streaming boxes or dongles.
Editor’s Choice
- Global smart TV sales have been steadily increasing over the years. In 2020, sales of smart TVs reached 186 million units, accounting for 79% of all flat-panel TVs sold.
- Smart TVs have become increasingly prevalent in households worldwide. As of the end of 2020, more than 34% of global households (over 665 million homes) owned a smart TV.
- This percentage is projected to exceed 50% by 2026, with 1.1 billion households having a smart TV.
- Connected TV (CTV) advertising spending has been on the rise, and it is expected to continue growing. In 2022, CTV advertising spending in the United States was valued at around 20.69 billion U.S. dollars.
- Xiaomi (Mi) led the CTV market in the United States with an 11% share in 2022. Samsung and LG followed closely with significant market shares.
- The presence of smart TVs has seen substantial growth in various countries. For example, in the United Kingdom, smart TV ownership increased from 11% of households in 2014 to nearly 67% by 2022.
- Consumers have shown a preference for larger screen sizes, particularly 43-inch smart TVs, which have experienced significant growth in shipments.
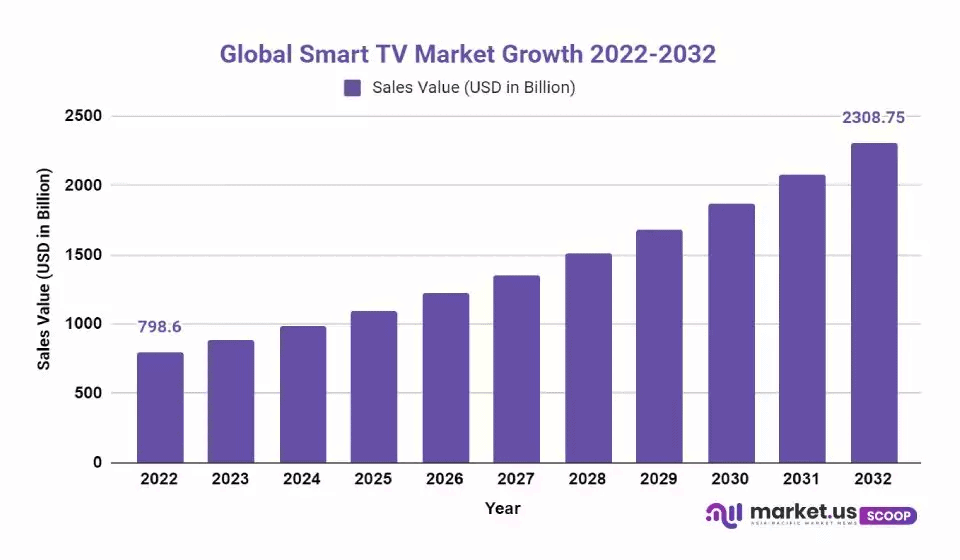
- The value of the global Smart TV market is expected to be USD 223.09 billion in 2023 and USD 668.53 billion in 2033, at a CAGR of 11.6%.
(Source: Market.us)
Smart TV Statistics – Regional Market Analysis
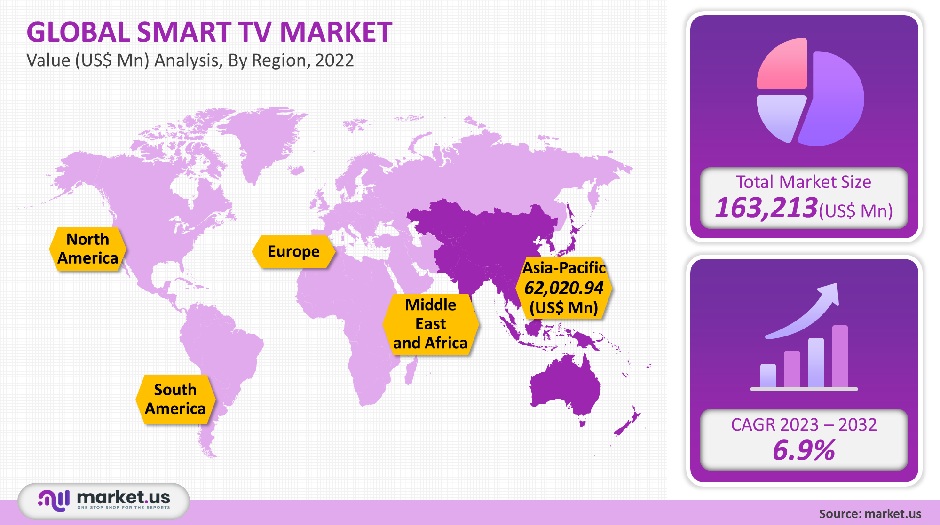
- In 2021, the Asia Pacific region commanded the largest market share of 38% in the smart TV industry. This dominance is projected to continue throughout the forecast period. Moreover, the Asia Pacific region is anticipated to witness the fastest growth from 2023 to 2032. Primarily driven by the increasing adoption of smart televisions in developing countries like India. The demand for 4K display technology is also expected to surge in the region due to consumer preferences for enhanced picture quality and sleek design. Which will create additional revenue generation opportunities.
- China plays a significant role in the regional market, but the emergence of new players like TCL Corporation and Hisense Co., Ltd., has intensified competition for larger established players.
- In the Middle East and Africa, a remarkable growth trend is expected, with an estimated Compound Annual Growth Rate (CAGR) of over 12% between 2023 and 2032.
(Source: Market.us)
Worldwide Smart TV Shipments by Vendor
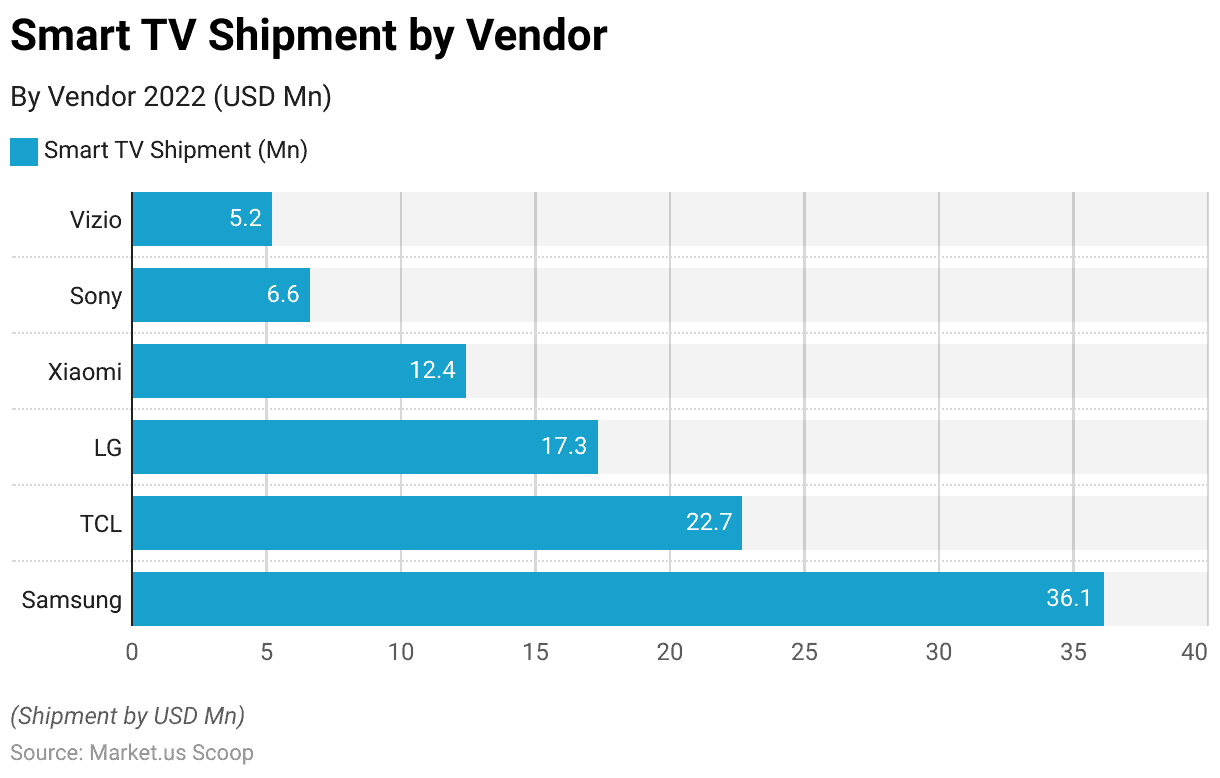
- According to the 2022 data on Smart TV shipments, Samsung emerged as the leading vendor with 36.1 million units shipped.
- Following closely behind was TCL with 22.7 million units, securing the second spot. LG ranked third with 17.3 million units shipped. While Xiaomi and Sony stood at the fourth and fifth positions, respectively, with 12.4 million and 6.6 million units shipped.
- Vizio completed the list with 5.2 million units shipped. These figures indicate the competitive landscape of the Smart TV market. Samsung holds a significant market share and several other key players vying for their positions in the industry.
(Source: Kagan Research Group)
Worldwide Smart TV Shipments by Operating System (OS) Statistics
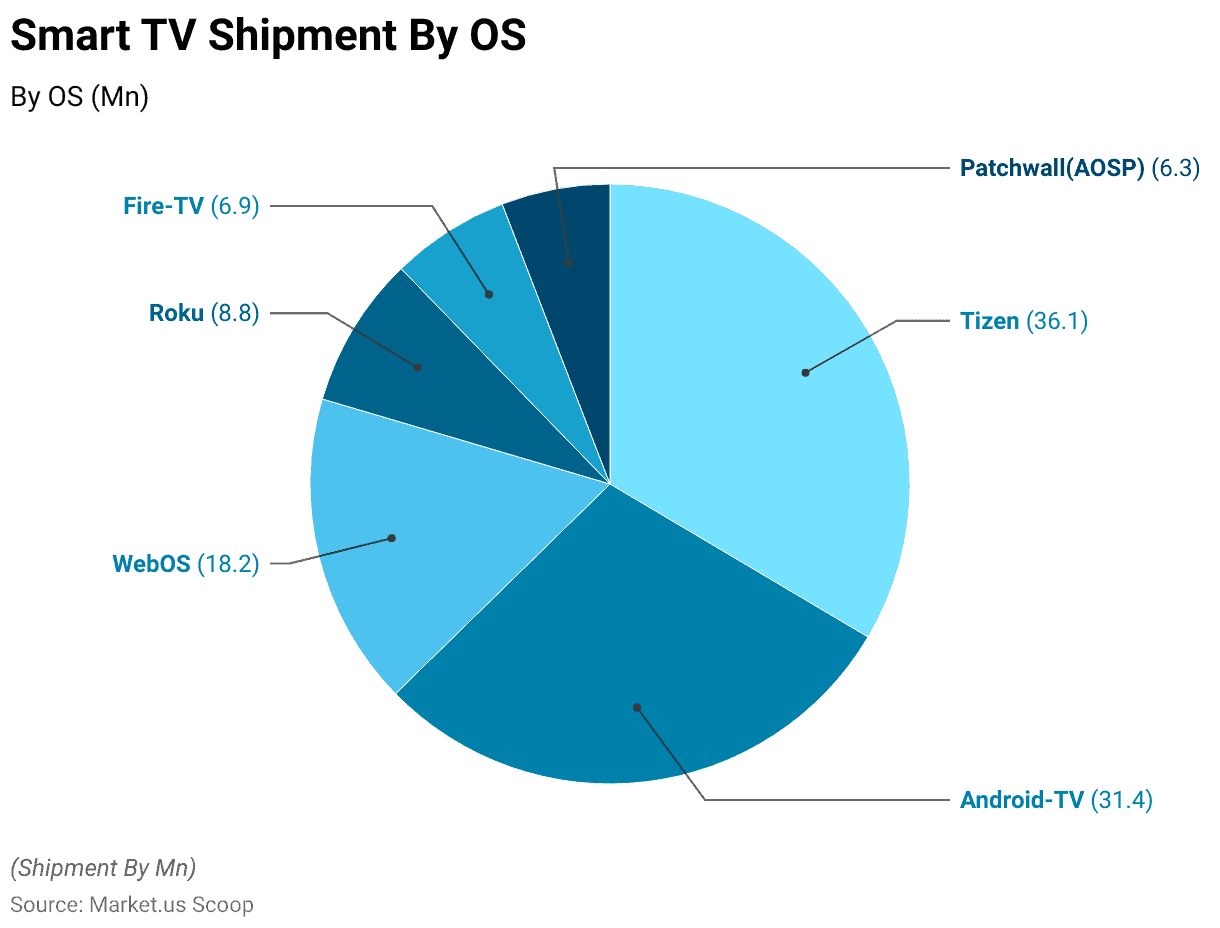
- In 2022, Tizen emerged as the leading OS with 36.1 million units shipped. Making it the most widely adopted OS for Smart TVs.
- Android TV closely followed with 31.4 million units shipped, securing a significant market share as well. WebOS ranked third. With 18.2 million units shipped, further solidifies its presence in the Smart TV market.
- Roku and Fire TV claimed the fourth and fifth positions, respectively, shipping 8.8 million and 6.9 million units. Patchwall (AOSP) completed the list with 6.3 million units shipped. These figures highlight the popularity of different operating systems among Smart TV manufacturers and consumers. Showcasing a diverse range of choices for consumers in the smart TV ecosystem.
(Source: Kagan Research Group)
Smart TV Statistics – Penetration and Adoption
- Smart TV ownership is set to exceed 1.1 billion households worldwide, representing 51% of all households, by the year 2026. By the end of 2020, approximately 665 million households, or 34% of global households, had already adopted smart TVs. Notably, the sales of smart TVs reached 186 million units in 2020, with a growth rate of 7.4%, and these devices accounted for a significant 79% of all flat panel TVs sold.
- In terms of manufacturers, Samsung maintained its dominant position as the leading smart TV manufacturer, securing the top spot in annual sales units for the ninth consecutive year. On the other hand, TCL surpassed LG and claimed the second position for the first time.
- In conclusion, the global smart TV market is witnessing remarkable growth, and the adoption rate is expected to continue rising in the years to come, with more than half of all households worldwide projected to own a smart TV by 2026.
(Source: Strategy Analytics)
Smart TV Statistics by Region
North America
- The North American market experienced the most robust growth in smart TV sales in 2022. This increase was largely driven by government stimulus cheques and an uptick in consumer spending on home entertainment products, as individuals found themselves spending more time at home due to COVID-19 restrictions.
- In the United States, a significant majority of individuals, approximately 87% of the population, have access to connected TV boxes in their homes. These devices are particularly popular among Americans aged between 18 and 34 years old.
- As of 2022, a survey carried out in the United States revealed that more than 50% of the participants owned either a smart TV or a connected TV in their households. This aligns with the growing trend of increased expenditure on digital content in the United States, surpassing 30 billion U.S. dollars in the same year.
- In 2020, Samsung maintained its position as the most favored smart TV brand among households in the United States, holding a consistent market share of 28 percent. Following closely were Alcatel/TCL and Vizio, with market shares of 13 percent and 12 percent, respectively, completing the top ranks of the list.
(Source: Strategy Analytics, Statista)
Europe
- Smart TVs have gained significant popularity in Europe over the past ten years, with an increasing number of households owning such devices.
- At present, more than half of the population in Europe possesses a smart TV set. For example, in 2022, approximately 67% of households in the UK, over 80% of households in Italy, and around 55% of households in France owned a smart TV.
- The presence of Smart TVs in UK households has seen significant growth over the years. In 2014, only 11 percent of UK households owned a Smart TV, but by 2022, this number had surged to nearly 67 percent, indicating a substantial increase in Smart TV ownership across the country.
- The adoption of Smart TVs has surpassed 50 percent, and there are strong indications that it will continue to grow significantly, as evident from the TV shipment data. In the fourth quarter of 2018, an impressive 76.5 percent of all televisions shipped in Western Europe were Smart TVs, while 63 percent of them were Ultra High Definition sets.
(Source: Statista)

Asia Pacific
- In 2022, smart TV shipments in India experienced a noteworthy YoY growth of 28%. Consumers displayed a preference for larger screen sizes, particularly 43-inch displays. Leading to a substantial 29% YoY growth in shipments of smart TVs of this size.
- Interestingly, the 43-inch size category also became available in the budget price range (INR 20,000-INR 30,000 or approximately $243-$364).
- In terms of brand performance, OnePlus, Vu, and TCL emerged as some of the fastest-growing brands in the smart TV segment in 2022.
- Xiaomi led the overall smart TV market with an 11% market share, closely followed by Samsung and LG.
- Moreover, the smart TV shipments within the INR 20,000-INR 30,000 price range witnessed an impressive 40% YoY growth, accounting for a 29% share of the market.
- During the same period, the average selling price (ASP) of smart TVs decreased by 8% YoY to reach approximately INR 30,650.
- In 2022, Xiaomi (Mi) secured the top position in the Indian smart TV market with an impressive market share of 17.5%.
More Insights
- Samsung followed closely behind with a market share of 15.4%, and LG held the third spot with an 11.7% share.
- Sony and OnePlus accounted for 6.4% and 5.8% of the market share, respectively. The remaining share of 43.2% was distributed among other brands in the industry.
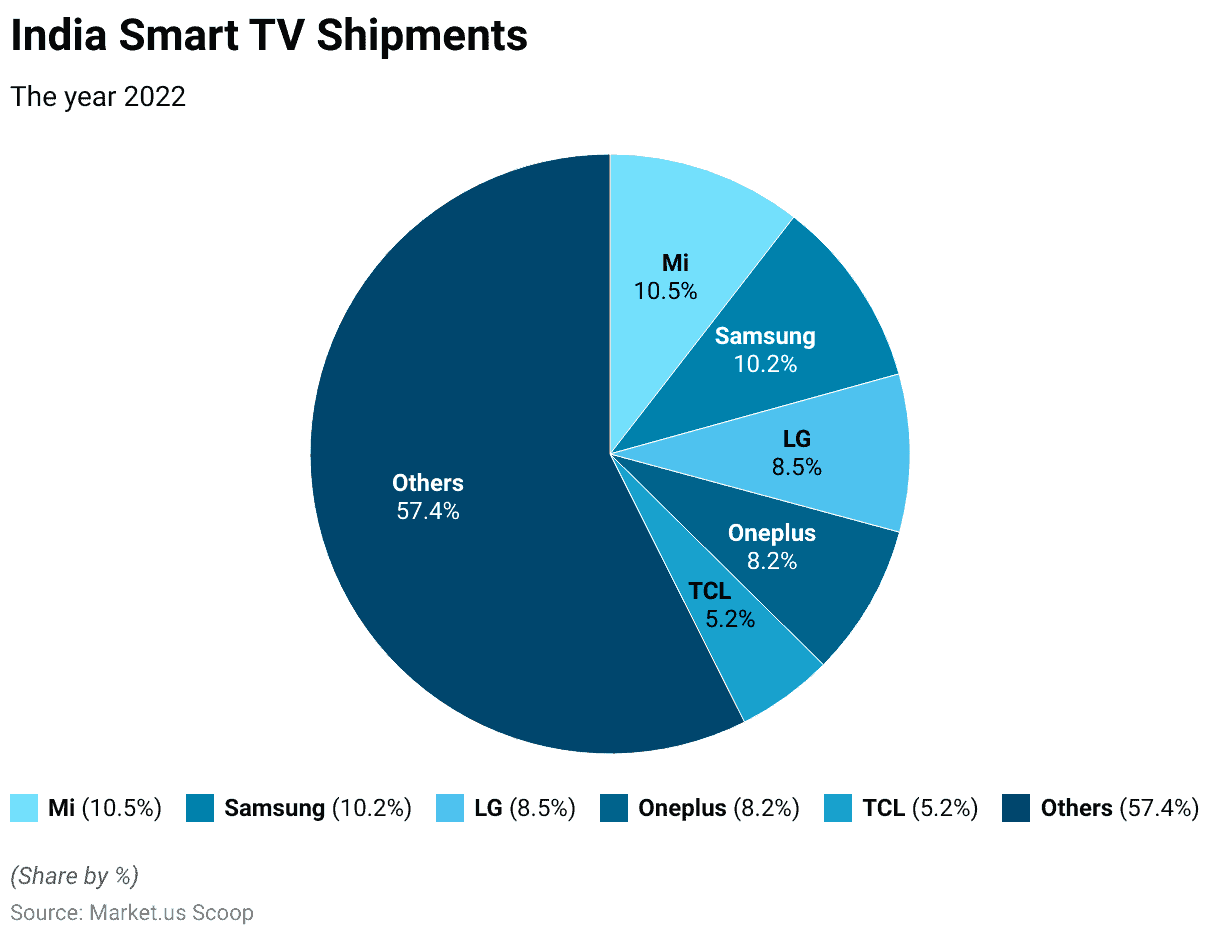
- In 2022, the Indian smart TV market witnessed a highly competitive landscape with multiple brands vying for market share.
- Xiaomi (Mi) and Samsung emerged as the top contenders, each holding a substantial market share of 10.5% and 10.2%, respectively.
- LG followed closely behind with an 8.5% share, while OnePlus and TCL secured 8.2% and 5.2% of the market, respectively.
- The remaining market share of 57.4% was divided among various other brands in the industry. This data highlights the diverse choices available to consumers in the Indian smart TV market, with a range of brands competing to cater to consumer preferences and demands.
(Source: Counterpoint Research)
Smart TV Statistics – Advertising and Monetization
- In the second quarter of 2022, Smart TVs saw a notable increase in their share of streaming video ad budgets, accounting for 33% of the total, compared to 28% in the same period the previous year. Additionally, Connected TV (CTV) was responsible for 53% of standard ad spending in Q2 2022.
- Looking back to 2019, Roku, Hulu, and YouTube together constituted 45.9% of the US CTV ad market. However, their combined market share has declined, currently making up approximately one-third of the market.
- In 2022, the total advertising spending in the United States reached a substantial value of 21.16 billion dollars, reflecting the significant investment in the advertising sector.
- CTV has gained immense importance in the media planning budgets of video buyers. With an impressive 76% of them considering it a “must buy” platform. This indicates the growing recognition of CTV’s effectiveness and influence in the advertising landscape.
Smart TV Statistics – Regional Advertising and Monetization
- In 2021, it was projected that connected TV (CTV) would represent approximately 4.7 percent of the overall advertising expenditure in the United States. The estimated CTV ad spend for the same year was around 13.4 billion dollars.
- In 2022, the United States witnessed a surge in connected TV (CTV) advertising spending, reaching an impressive value of 20.69 billion U.S. dollars. This emerging trend in advertising combines the convenience of online advertising with the broad reach of traditional TV.
- Given the current growth trajectory, it is projected that CTV ad spending will continue its upward trajectory and is expected to reach an astounding 40.9 billion U.S. dollars by the year 2027. This rapid growth showcases the increasing recognition of the effectiveness and potential of CTV advertising in reaching and engaging with consumers. (Source: Statista)
- In a survey conducted in November 2020, which included U.S. brand and agency media planners, buyers, and marketers planning to reallocate their linear TV budget to OTT/CTV in 2021. 81 percent of the participants cited targeting and efficiency as one of the top three reasons for making this shift.
Recent Developments
Acquisitions and Mergers:
- Samsung is planning significant acquisitions in 2024 to enhance its portfolio in the smart TV and electronics market. The company is actively seeking to expand through strategic mergers.
- Last year, Samsung acquired eMagin and Roon, indicating a focus on enhancing its display and audio technology offerings.
New Product Launches:
- Panasonic announced a global partnership with Amazon to integrate Fire TV into its new smart TVs starting in 2024. This integration will include models like the Panasonic Z95A and Z93A, featuring Fire TV built-in with Alexa voice control.
- Samsung showcased its new AI-powered technologies at CES 2024, including advancements in smart TV capabilities.
Market Innovations:
- Amazon introduced Matter Casting for Fire TV and Echo Show 15 devices. Allowing seamless content casting from iOS and Android devices. This feature enhances the connectivity and user experience of smart TVs.
- At CES 2024, Amazon also demonstrated the latest generation of its Zoox robotaxi. Highlighting advancements in automotive AI integrated with smart home technology.
Conclusion
Smart TVs have become increasingly popular and widely adopted worldwide. According to statistics, more than half of all households globally are projected to own a smart TV by 2026, representing 1.1 billion homes.
The sales of smart TVs have been on a steady rise, with North America experiencing significant growth, driven by government stimulus and increased spending on home entertainment during the COVID-19 pandemic.
The Asia Pacific region stands out as a dominant player in the global smart TV market, accounting for the largest revenue share.
The Middle East and Africa are projected to witness the fastest growth in terms of revenue, driven by rapid urbanization and rising demand for smart televisions.
In specific countries like the United States and the United Kingdom. The penetration of smart TVs has grown significantly over the years, with the majority of households owning these devices.
Furthermore, the preference for larger screen sizes and 4K display technology has led to an increase in smart TV shipments, making it a lucrative market for manufacturers.
FAQs
How many households worldwide own a smart TV?
As of the end of 2020, approximately 34% of global households, totaling over 665 million homes, owned a smart TV. This number is projected to grow to 51%, representing 1.1 billion homes, by 2026.
Which regions dominate the global smart TV market?
The Asia Pacific region holds the largest market share in terms of revenue. With North America following as the second-largest contributor to the smart TV market.
Which brands lead the smart TV market in terms of sales?
Samsung has maintained its position as the leading smart TV manufacturer in terms of annual sales units for several consecutive years. TCL is another fast-growing brand that has climbed into the second position in terms of annual sales units.
What are the growth trends for connected TV (CTV) advertising spending?
CTV advertising spending has been increasing steadily, with a significant growth rate projected for the future. In 2022, CTV advertising spending in the United States was valued at around 20.69 billion U.S. dollars, and it is expected to reach 40.9 billion U.S. dollars by 2027.
Which size of smart TV is most preferred by consumers?
Consumers have shown a preference for larger screen sizes, especially 43-inch smart TVs, which have experienced significant growth in shipments.
Discuss your needs with our analyst
Please share your requirements with more details so our analyst can check if they can solve your problem(s)