


Table of Contents
- Introduction
- Editor’s Choice
- Global Electric Vehicle Market Size
- Global Electric Vehicles Market Size by Segment
- Regional Market Analysis
- Key Players in the Electric Vehicles Industry
- Electric Vehicles Charging Infrastructure
- Electric Vehicles Battery Demand
- Carbon Emissions Reduction
- Government Policies and Incentives
Introduction
According to Electric Vehicles Statistics, An electric vehicle, sometimes known as an EV, is a type of vehicle that is propelled by one or more electric motors or traction motors. Unlike classic ICE vehicles that run on gasoline or diesel, electric vehicles (EVs) are powered by energy stored in batteries or supplied by an external power source.
The primary energy source for EVs is electricity, converted into mechanical energy to drive the vehicle. Different types of electric vehicles cater to various needs and preferences, offering options for emissions reduction, energy efficiency, and varying ranges. As technology advances, the electric vehicle landscape evolves, with more models and variations becoming available to consumers.
Editor’s Choice
- In 2020, global electric vehicle market sales reached approximately 3.1 million units, accounting for about 4.4% of global passenger car sales.
- China has been a significant driver of EV adoption, with over 1.3 million EVs sold in 2020. Europe has also seen rapid growth, with countries like Norway having a particularly high EV market share.
- The Tesla Model 3 was one of the best-selling EVs globally, followed by models like the Renault Zoe, Nissan Leaf, and Volkswagen ID.3.
- As of 2021, some European countries saw EV market shares exceeding 10% of total new car sales. Norway, for example, had over 54% EV market share in 2020.
- There were around 862,118 public charging points worldwide in 2020, with China, Europe, and North America having the largest share.
- The cost of EV batteries has been decreasing steadily. In 2020, the average price of a lithium-ion battery pack fell to around $137 per kWh, a significant reduction from previous years.
- The average range of affordable EVs has been increasing. In 2021, several models offered ranges of over 200 miles (320 kilometers) on a single charge.
Global Electric Vehicle Market Size
- The global electric vehicle (EV) industry has witnessed remarkable growth in recent years, as evidenced by revenue figures. In 2018, the industry generated approximately $112.9 billion in revenue, which continued to rise steadily in subsequent years.
- The upward trajectory of the electric vehicle industry continued into 2023, with projected revenues of $561.4 billion, reinforcing the sustained demand for electric vehicles across global markets.
- By 2028, the revenue is projected to surge to $906.7 billion, underscoring the sustained growth and potential economic significance of electric vehicles on a global scale.
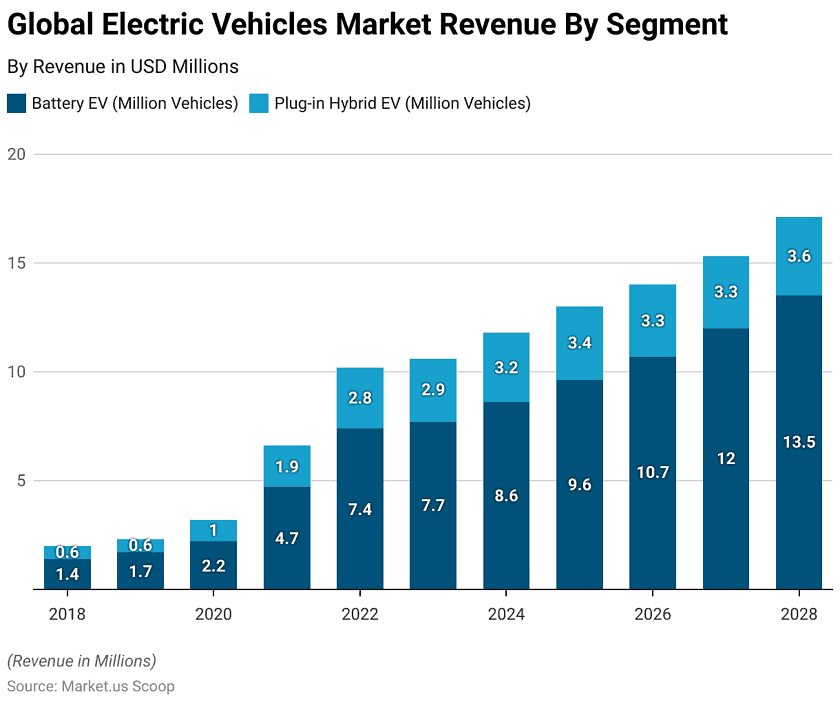
Global Electric Vehicles Market Size by Segment
- The electric vehicle market has exhibited a remarkable evolution across different segments, with the adoption of battery electric vehicles (BEVs) and plug-in hybrid electric vehicles (PHEVs) gaining significant traction. In 2018, BEVs comprised 1.4 million vehicles globally, marking the beginning of a transformative trend.
- As 2023 progressed, the adoption of BEVs remained robust, with the global count reaching 7.7 million.
- Looking ahead, the trajectory of BEV adoption is expected to maintain its upward trend, with projected numbers of 8.6 million in 2024 and 9.6 million in 2025.
- As the technology and infrastructure continue to improve, the number of BEVs is anticipated to reach 10.7 million by 2026 and expand to 12 million in 2027, demonstrating the relentless commitment to electric mobility.
- By 2028, the number of BEVs is projected to reach an impressive 13.5 million, underscoring the industry’s collective dedication to a cleaner transportation landscape.
Regional Market Analysis
United States Electric Vehicles Market
- In 2022, the electric vehicle (EV) sector in the United States achieved unprecedented milestones, with sales of nearly 918,500 light electric vehicles.
- This figure represented more than two and a half times the sales recorded in 2018, a pivotal year when the surge in demand for Tesla’s Model 3 commenced. This sedan is one of the most popular electric vehicles in the U.S. market.
- Despite new entrants striving for profitability, Tesla continues to assert its dominance with an estimated 536,100 electric vehicle sales in the U.S. in 2022.
- However, the competitive landscape is gaining momentum as manufacturers like General Motors introduce fresh electric models to their vehicle portfolios.
China Electric Vehicles Market
- China, recognized as the leading electric vehicle (EV) manufacturer, produced a substantial 3.5 million EVs in 2021, marking a remarkable 1.6-fold increase compared to the previous year.
- Impressively, revenues generated from the EV market in the same year amounted to around $102.2 billion, establishing the highest record within the Asia-Pacific region.
Europe Electric Vehicles Market
- Anticipated data indicates that the European electric Vehicles market is set to achieve a revenue milestone of approximately $164.0 billion in 2023.
- Forecasts predict a consistent annual growth rate (CAGR 2023-2028) of 11.99%, leading to a projected market size of around $288.9 billion by 2028.
- The sales of Electric Vehicles in Europe are expected to culminate in 4.8 million units by 2028.
- Furthermore, the price dynamics within the Electric Vehicles market are projected to follow a volume-weighted average of $60,000 in 2023.
Key Players in the Electric Vehicles Industry
- Throughout the quarters spanning from Q2 2021 to Q1 2023, notable shifts in market share among different automotive brands have been observed. BYD Auto, for instance, started at 7% in Q2 2021 and progressively gained traction, reaching 21% by Q1 2023.
- Similarly, Tesla maintained a relatively consistent presence, hovering between 12% and 16% during this period.
- In contrast, Volkswagen witnessed a slight decline in market share, moving from 14% in Q2 2021 to 7% in Q1 2023.
- From 2015 to 2021, Tesla’s annual turnover witnessed remarkable growth for seven years, reflecting a series of substantial leaps. Starting at 4.046 billion in 2015, the turnover surged by 26.52% in the following year, reaching 7 billion in 2016.

Electric Vehicles Charging Infrastructure
Slow chargers
- On a global scale, over 600,000 public slow charging points were added in 2022, with China contributing 360,000 to this total, resulting in a cumulative count of more than 1 million slow chargers in the country by the end of the year.
- Consequently, China accounted for over 50% of the worldwide stock of public slow chargers by the close of 2022.
- In Europe, the second-largest contributor, the tally of slow chargers reached 460,000 in 2022, indicating a notable 50% increase from the preceding year.
Fast chargers
- In 2022, there was a global increase of 330,000 fast chargers, with China contributing most of this growth, accounting for nearly 90%. The expansion of fast charging infrastructure serves as a solution for the absence of home chargers in densely populated urban areas. It aligns with China’s ambitions for swift electric vehicle adoption.
- Within Europe, the cumulative count of fast chargers reached upwards of 70,000 by the conclusion of 2022, marking a growth of approximately 55% compared to 2021.
- In 2022, the United States set up 6,300 fast chargers, with Tesla Superchargers accounting for approximately 75%.
Electric Vehicles Battery Demand
EV Battery Demand by Region
- In 2022, there was a significant surge in demand for automotive lithium-ion (Li-ion) batteries, reaching 550 GWh, marking a substantial 65% increase compared to the 330 GWh recorded in 2021.
- China, a prominent player in this trend, experienced an impressive 70% surge in vehicle battery demand.
- In the United States, automotive battery demand exhibited an approximately 80% increase, even though the rise in electric car sales was around 55% in 2022.

EV Battery Demand by Mode
- For six years, from 2015 to 2020, the EV battery demand experienced notable shifts in the distribution of vehicle types across different categories.
- In 2015, the numbers stood at 13.9 units for cars and vans, 21.3 units for buses, and 3.5 units for other types. These figures evolved significantly in subsequent years, with 2016 rising to 23.2 units for cars and vans, 29.4 units for buses, and three for other categories.
- By 2020, the numbers had escalated to 133 units for cars and vans, 19.9 units for buses, and 5.8 units for other categories. These variations reflect the dynamic changes in transportation preferences and needs over these six years.
Carbon Emissions Reduction
- The comparison between normal gas and electric vehicles regarding kilometers covered reveals interesting insights. For a distance of 50,000 kilometers, normal gas vehicles emit CO2 of 17 units, whereas electric vehicles emit 11.2 units.
- When the distance extends to 100,000 kilometers, CO2 emissions stand at 27.7 units, whereas electric vehicles improve to 13.2 units.
Government Policies and Incentives
- In 2020, Canada remained committed to bolstering essential infrastructure and incentives for zero-emission vehicles (ZEVs), driven by its heightened climate ambitions of achieving net-zero emissions by 2050.
- Canada established ZEV targets, aiming for 10% of light-duty vehicle (LDV) sales to be ZEVs by 2025, escalating to 30% by 2030 and ultimately reaching 100% by 2040.
- In 2020, the United States took a comparatively less supportive stance towards electric vehicles (EVs) when compared to China and Europe.
Discuss your needs with our analyst
Please share your requirements with more details so our analyst can check if they can solve your problem(s)