
Market Overview
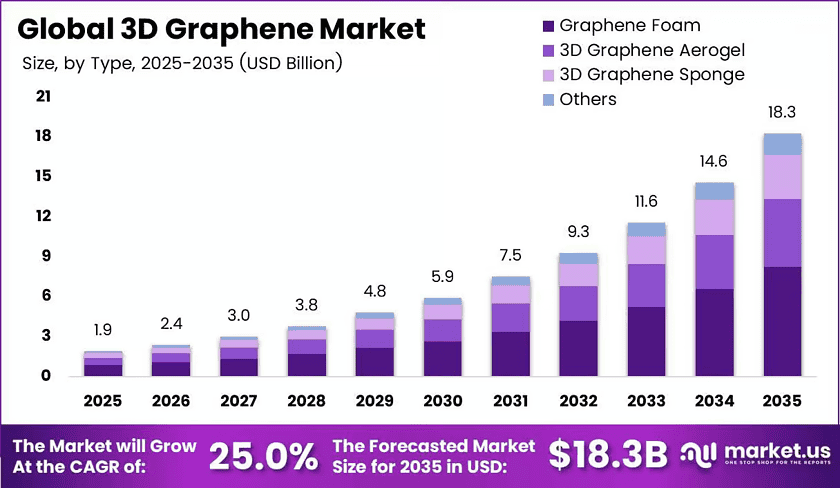
New York, NY – September 01, 2026 – The Global 3D Graphene Market reached USD 1.9 billion in 2025. Analysts expect the market to climb to USD 18.3 billion by 2035. Therefore, revenue should expand at a 25.0% CAGR between 2026 and 2035. Asia Pacific holds a 46.2% share and about USD 0.9 billion in revenue. This pace shows how quickly advanced carbon materials enter mainstream manufacturing.
Battery build-outs drive much of this demand, according to IEA data. The world added 108 GW of new storage in 2025, about 40% above 2024. Utility-scale projects supplied roughly 87 GW of that total. Therefore, each new gigawatt lifts orders for graphene foams and aerogels.
Chip demand adds a second growth engine. According to the Semiconductor Industry Association, global chip sales hit USD 791.7 billion in 2025, up 25.6% from USD 630.5 billion. Moreover, stronger chip output raises orders for graphene heat spreaders, interposer layers, and cooling films.
China explains the regional lead. The IEA reported that China added just over 63 GW of battery capacity in 2025, roughly one-third more than in 2024. Electric cars reached nearly 55% of new car sales there. Additionally, Chinese carmakers supplied 60% of global electric car sales.
Key Takeaways
- The 3D Graphene Market stands at USD 1.9 billion in 2025 and will reach USD 18.3 billion by 2035.
- Revenue grows at a 25.0% CAGR between 2026 and 2035.
- Graphene Foam leads the Type segment with a 46.2% share.
- 3D Graphene Sheets lead the Product Type segment with a 32.9% share.
- Energy Storage leads the Application segment with a 35.5% share.
- Electronic Devices lead the End-User Industry segment with a 34.6% share.
- Asia Pacific leads with a 46.2% share and USD 0.9 billion in revenue.
➤ Download Exclusive Sample Of This Premium Report (Including Full TOC, Table & Figures)- https://market.us/report/3d-graphene-market/request-sample/
Market Segmentation
By Type
Graphene Foam leads the type segment with a 46.2% share. Its open-cell design creates a very high surface area. Therefore, foam absorbs energy and heat better than solid carbon forms, which suits battery, filter, and insulation makers at the same time.
Global manufacturing value added stood near USD 16.8 trillion in 2024. Rising factory output widens the buyer base for advanced grades such as aerogel. Consequently, foam and aerogel suppliers win new sensor, filtration, and insulation contracts faster than other product families.
By Product Type
3D Graphene Sheets hold 32.9% of the product type segment. Manufacturers cut, layer, and shape sheets into flexible films for circuits, sensors, and displays. Therefore, chipmakers that need better heat-spreading test sheets first, because they fit existing electronics lines without new tooling.
3D Graphene Powder grows fastest, since it blends into coatings, inks, and composites without complex steps. Global chip sales for June 2026 alone reached USD 134.5 billion, a 123.6% yearly rise. That surge pulls easy-to-mix materials into many linked industries. Consequently, powder scales at lower cost.
By Application
Energy Storage leads applications with a 35.5% share. Grid operators need batteries that smooth solar and wind swings. Utility-scale projects delivered 87 GW of the 108 GW added in 2025, which explains why storage buyers absorb the largest volume of porous graphene output.
Electronics grows fastest, as chip designers hunt materials that cool devices and carry signals better. Deloitte projects global semiconductor sales near USD 975 billion in 2026, with growth quickening to 26% after 22% in 2025. Therefore, AI hardware spending widens the market for graphene films.
By End-User Industry
Electronic Devices lead the end-user segment with 34.6%. Logic chip sales alone reached USD 301.9 billion in 2025 and grew 39.9%. That makes logic the largest chip category. Consequently, device makers seek thin, strong materials that add speed and remove heat.
Automotive expands fastest because carmakers shift toward electric and connected models that need lighter parts. Global vehicle production passed 68.7 million units in the first nine months of 2025, up 4% year over year. Moreover, that steady output supports faster qualification of new composite materials.
Regional Analysis
Asia Pacific holds a 46.2% share and about USD 0.9 billion in revenue. The IEA counted a record 2.3 million electric vehicle sales in India in 2025, up 75%. Therefore, battery packs, thermal pads, and sensor films keep regional demand for porous graphene rising.
North America ranks as the fastest-growing region. The United States added 19 GW of battery capacity in 2025, roughly 60% more than 2024, with utility-scale projects above 16 GW. Consequently, suppliers of conductive additives and porous electrode scaffolds gain steady, repeatable order volumes.
Drivers
Battery electrode integration drives the strongest growth, adding about 3.2% to the forecast CAGR. Pilot cells with graphene-enhanced electrodes cut charging time by 15% to 20% and lift cycle life above 30%. Therefore, cell makers gain a clear performance reason to switch materials.
Falling production costs form the second driver. Template-grown and CVD graphene prices dropped from near USD 100 per gram in 2018 to about USD 45 per gram by 2023. Consequently, blended additive designs can trim pack input costs by 8% to 12%.
Use Cases
Utilities place porous graphene inside grid storage electrodes to stabilize renewable supply. The material forms a continuous conductive network with short electron paths. Therefore, storage systems charge faster and hold output over longer service periods, which helps operators meet reliability targets during peak evening demand.
Device makers apply graphene sheets as heat spreaders and interposer layers in compact electronics. The thin structure moves heat away from dense processors. Consequently, phones, laptops, and wearables handle heavier workloads without slowing down, so designers keep shrinking product size while raising computing power.
Business Opportunities
Water treatment offers the clearest open space for suppliers. Porous graphene membranes raise water flux and cut energy use per liter treated. However, municipal buyers demand full-scale validation, so producers that begin qualification early can lock in long-term desalination and filtration contracts.
Biomedical scaffolds and sensors open a second revenue path across North America and Europe. Hospitals and research groups value graphene strength and conductivity for tissue scaffolds and diagnostic devices. Therefore, suppliers with medical-grade quality systems can enter a premium segment that still has limited direct competition.
Major Challenges
Quality consistency remains the main barrier to industrial scale. Dispersion stability, layer uniformity, and defect control weaken as throughput climbs. Consequently, producers invest in automated inspection and in-house testing laboratories, because buyers reject batches that fall outside agreed defect limits.
High-purity precursors and specialty gases stay costly and hard to source. Tighter lending also slows financing for new plants. Therefore, several producers delay the move from pilot lines to full commercial capacity, which limits supply just as battery and electronics buyers expand orders.
Top Key Players in the Market
- Graphenea
- XG Sciences
- Haydale Graphene Industries
- Applied Graphene Materials
- NanoXplore
- Versarien
- G6 Materials Corp.
- Other
Conclusion
The 3D graphene market moves from laboratory promise to industrial supply, led by energy storage and electronics demand. Asia Pacific holds the largest share, while North America grows fastest on grid storage build-outs. Moreover, falling production costs widen adoption across automotive and healthcare users. However, quality consistency, precursor supply, and trade controls still shape how quickly suppliers convert pilot capacity into profitable commercial volume.
Discuss your needs with our analyst
Please share your requirements with more details so our analyst can check if they can solve your problem(s)