Table of Contents
Introduction
According to Wearable Technology Statistics, Wearable technology encompasses electronic devices worn on the body, serving various functions such as health monitoring, communication facilitation, and convenience enhancement. These devices include smartwatches, fitness trackers, AR glasses, smart apparel, hearables, and medical wearables. They find uses in tracking health and fitness, enabling communication, assisting with navigation, delivering entertainment, supporting workplace tasks, and enhancing healthcare services.
The wearable technology market has grown substantially, with major players like Apple and Samsung dominating the consumer wearable sector. Challenges in this domain include privacy concerns, battery life limitations, and adherence to regulatory standards. At the same time, future trends encompass the integration of artificial intelligence, the adoption of electronic textiles (e-textiles), and an extended role within the Internet of Things (IoT) ecosystem.
Editor’s Choice
- The wearable technology market is experiencing substantial growth at a CAGR of 14.60%, with market revenue projected to increase steadily over the next decade.
- In 2022, the wearable technology market revenue stood at USD 61.0 billion, expected to rise to USD 231.0 billion in 2032.
- North America commands the largest share, accounting for 33.8% of the market, showcasing a strong presence and adoption of wearable tech in this region.
- Sony Corp. is a leading market player, commanding a substantial 15% share.
- Approximately 40% of global wearable technology users find these devices indispensable, while 25% report wearing them even while sleeping.
- In 2023, Earwear devices will have 325 million shipments, commanding a substantial market share of 62.10%.
- In 2019, approximately 56.7 million individuals in the United States regularly used wearable devices.
- During the same year, the sales of health wearables reached a substantial 223 million units, which has risen.
- Moving into 2020, shipments of wearables surged to 368.2 million units, indicating a significant increase in adoption and demand for these devices.
Wearable Technology Market Overview
Global Wearable Technology Market Size
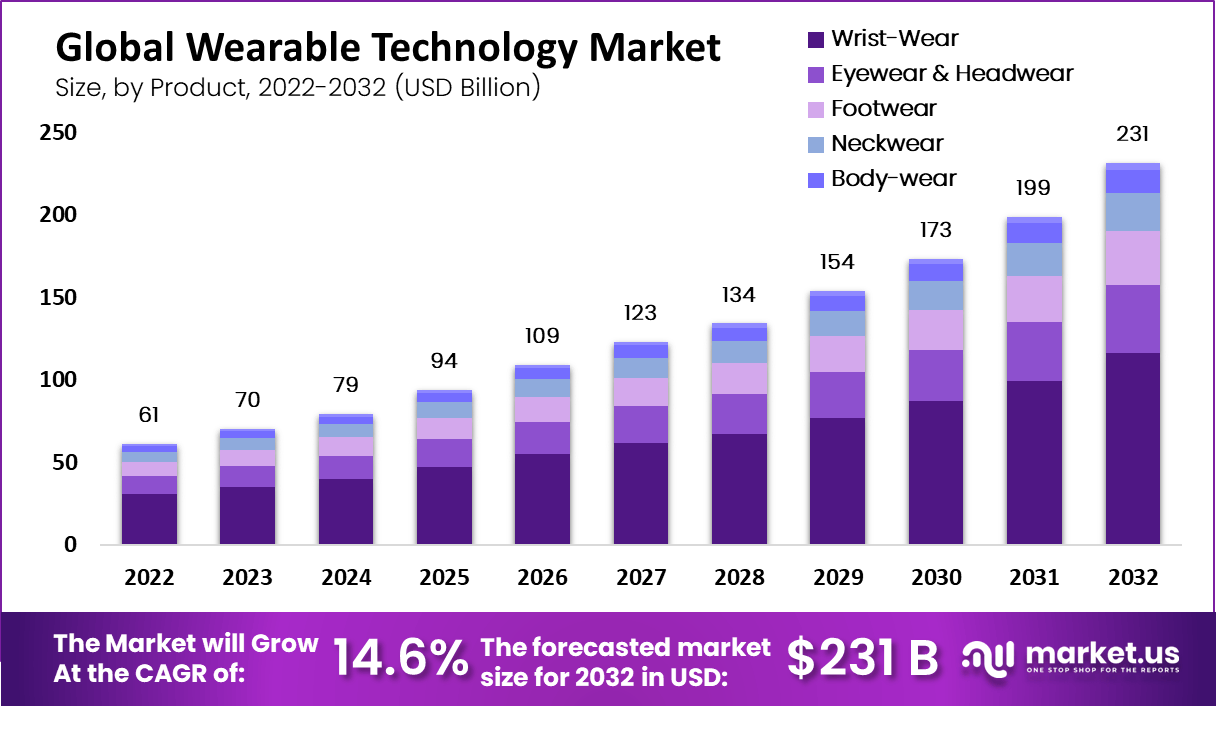
- The wearable technology market is experiencing substantial growth at a CAGR of 14.60%, with market revenue projected to increase steadily over the next decade.
- In 2022, the market’s revenue stood at USD 61.0 billion, expected to rise to USD 70.0 billion in 2023.
- The growth becomes even more pronounced as we look ahead to 2029, with projected revenue of USD 154.0 billion, and 2030 is expected to see a significant milestone with revenue reaching USD 173.0 billion.
- This upward trajectory continues through 2031 and 2032, with market revenues estimated to be USD 199.0 billion and USD 231.0 billion, respectively.

Global Wearable Technology Market Share- By Region
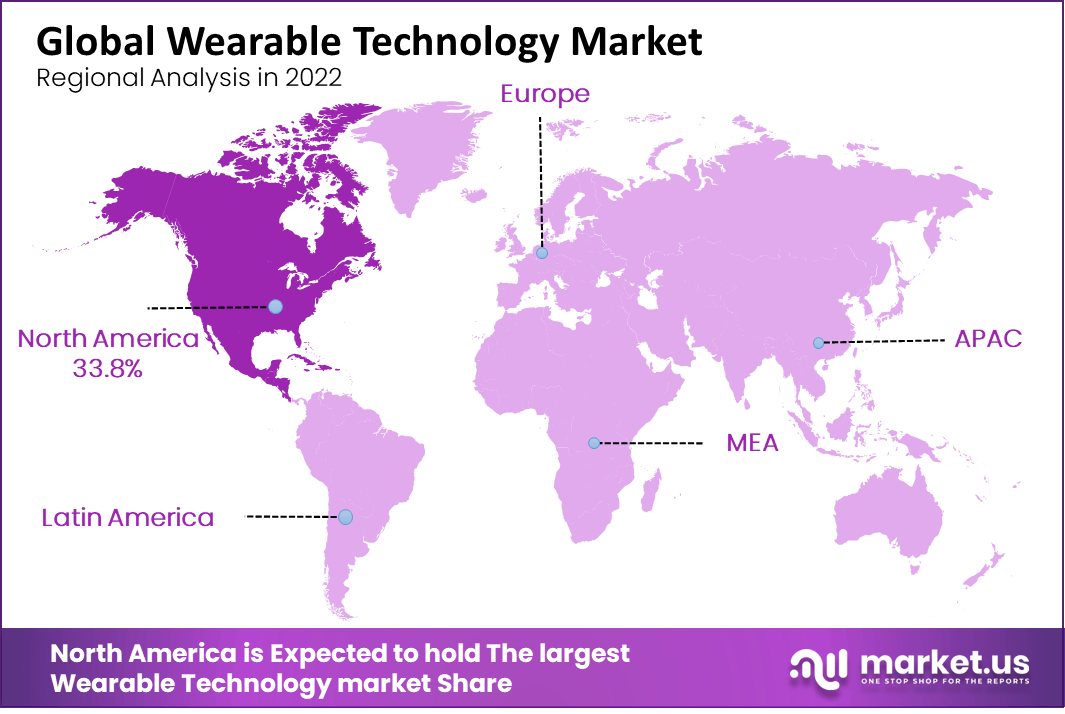
- The global wearable technology market exhibits a diversified market share distribution across different regions.
- North America commands the largest share, accounting for 33.8% of the market, showcasing a strong presence and adoption of wearable tech in this region.
- Europe follows closely behind with a market share of 25.4%, reflecting a significant market presence and consumer interest in wearable devices.
- The Asia-Pacific (APAC) region holds a substantial market share of 30.1%, indicating the growing popularity and adoption of wearable technology in this dynamic and tech-savvy region.
- In contrast, Latin America and the Middle East & Africa (MEA) regions have comparatively smaller market shares, 6.9%, and 3.8%, respectively, suggesting potential growth opportunities for wearable technology in these emerging markets.

Key Players and Brands
Leading Wearable Technology Companies According to Market Share
- In the highly competitive wearable technology market, various prominent companies vie for market share.
- Sony Corp. is a leading player, commanding a substantial 15% share.
- Apple Inc. and Alphabet Inc. share equal ground with 12% each, solidifying their positions as significant industry contributors.
- Huawei Technologies Group Co., Ltd. follows closely behind with an 11% market share. Samsung Electronics Co., Ltd. and Xiaomi Corp. contribute 10% and 9%, further diversifying the market.
- Meanwhile, sportswear giants Adidas AG and Nike, Inc. each claim 8% and 9% of the market share, attesting to their influence in the wearables sector.
Number of Connected Wearable Devices Worldwide
- The number of connected wearable devices worldwide has shown a consistent upward trend over the years, reflecting the growing popularity and integration of wearable technology into daily life.
- In 2019, there were 722 million connected wearables in use globally.
- This figure saw a notable increase in 2020, reaching 835 million, demonstrating a surge in adoption.
- The momentum continued into 2021, with the number of connected wearables rising to 929 million.
- As of 2022, the global market for connected wearables has expanded even further, with a remarkable 1,110 million devices worldwide.

Consumer Adoption and Usage
By Age
- As per a recent survey, the utilization of wearable healthcare devices in the past 12 months among different age groups presents a varied landscape.
- Among adults aged 18-34, approximately 10.2% reported using wearable healthcare devices, indicating a relatively higher adoption rate among this younger demographic.
- In the 35-49 age group, 9.32% reported using such devices, demonstrating a comparable level of engagement. However, as the age groups progress, the adoption rates decline.
- Adults aged 50-64 had a 7.93% adoption rate, while those in the 65-74 age group reported a lower 2% usage rate.
- The trend continues as individuals reach the age of 75 and above, with an adoption rate of 0.8%.

According to Gender
- The utilization of wearable healthcare devices in the past 12 months exhibits gender-based differences in adoption rates.
- Among males, approximately 13.54% reported using wearable healthcare devices, indicating a moderate level of engagement.
- In contrast, females showed a slightly higher adoption rate, with 16.41% reporting usage.
- Interestingly, despite this higher adoption among females, a comparable proportion of both genders, around 34-36%, reported not using such devices.

By Education
- In the past 12 months, the utilization of wearable healthcare devices has shown interesting variations across different educational backgrounds.
- Among individuals with less than a high school education, a relatively low percentage of 0.78% have used such devices, while the majority, accounting for 4.14%, have not.
- In contrast, high school graduates exhibit a slightly higher adoption rate, with 3.49% reporting using wearable healthcare devices, while 18.24% have not utilized them.
- Moving on to those with some college education, the data indicates a significant increase in adoption, with 12.75% using these devices, while 28.54% have chosen not to.
- Interestingly, among individuals who are at least college graduates, 12.85% have embraced wearable healthcare technology, while 19.21% have not.

According to Income
- Approximately 34% of wearable technology users worldwide belong to the low-income category, while those in the medium-income group make up around 41% of the total wearable user base.
- Conversely, users from the high-income category constitute a smaller proportion, accounting for only about 25% of all wearable technology users globally.
Consumer Response On Wearable Technology
- Approximately 40% of global wearable technology users find these devices indispensable, while 25% report wearing them even while sleeping.
- About 70% of users trust their favorite gadget manufacturers to prioritize data security, making these brands more reliable than internet and communication providers.
- Nearly 43% of wearable gadget users believe that smartphones will eventually be replaced by built-in wearable tech.
- Around 40% of wearable technology users feel more at ease using search technologies, reducing their smartphone usage in favor of smartwatches.
- By the end of 2020, 88% of users expect wearable devices to offer additional health and wellness features.
Shipments of Wearable Devices
- The wearable device market is characterized by several product categories, with “Earwear” emerging as the dominant segment in terms of shipment volume and market share.
- In 2023, Earwear devices will have 325 million shipments, commanding a substantial market share of 62.10%.
- This category is expected to continue its growth trajectory, reaching 404 million shipments and maintaining a significant market share of 62.70% by 2027, with a compound annual growth rate (CAGR) of 5.60% over the five years.
- Smartwatches also hold a substantial market share, with 162.2 million shipments and a 31.00% market share in 2023.
- They are anticipated to see steady growth, reaching 205.3 million shipments and maintaining a 31.90% market share in 2027, with a CAGR of 6.10%.
- In contrast, Wristbands exhibit a declining trend, with 33.8 million shipments and a 6.50% market share in 2023, projected to decrease to 31.7 million shipments and a 4.90% market share by 2027, reflecting a negative CAGR of –1.60%.
Global Spending on Wearable Devices
- The end-user spending on wearable devices worldwide witnessed significant growth across various categories from 2019 to 2022.
- Smartwatches led the way, with expenditures increasing from 18,501 million dollars in 2019 to 31,337 million in 2022.
- Similarly, ear-worn devices experienced substantial growth, rising from 14,583 million dollars in 2019 to 44,160 million dollars in 2022.
- In contrast, wristbands gradually declined spending, from 5,101 million dollars in 2019 to 4,477 million in 2022.
- Head-mounted displays and smart clothing also displayed growth in spending, with head-mounted displays going from 2,777 million dollars in 2019 to 4,573 million dollars in 2022 and smart clothing increasing from 1,333 million dollars in 2019 to 2,160 million dollars in 2022.

Wearable Technology Usage by Country
- The adoption of wearable technology varies across countries, with China leading the way, with 34% of its population using wearables.
- Close behind is India, where 33% of people have embraced wearable devices.
- In the United States, 32% of the population uses wearables, reflecting a strong presence in the tech-savvy nation.
- The United Kingdom follows with 27%, while Sweden and Canada stand at 25%.
- In the Netherlands, 20% of the population uses wearables, while Germany and South Korea report 19% and 17% adoption rates, respectively.
- Brazil rounds out the list, with 15% of its population using wearable technology.

Barriers to Adoption of Wearables
- The reasons for individuals abandoning wearable technology devices are multifaceted.
- A significant portion, 21%, cited limited functionality and use as a primary factor leading to abandonment.
- Additionally, 14% mentioned that wearables weren’t standalone, indicating a desire for greater independence from other devices.
- A lack of inbuilt internet connectivity and inaccurate data or information were each reported by 9% of respondents, emphasizing the importance of reliable and connected functionality.
- Poor integration with smartphones and the availability of new devices with superior features also accounted for 9% of the responses, highlighting the need for seamless connectivity and continuous innovation.


