


Table of Contents
- Flood Insurance Market Size
- Specific Country Statistics
- Emerging Trends
- Growth Factors
- By Coverage Type – Content Coverage (62.8%)
- By Provider Type – National Flood Insurance Program (58.3%)
- By Distribution Channel – Direct Sales (72.5%)
- United States – USD 5.2 Billion, CAGR 13.4%
- North America – 45.3%
- Driver Analysis
- Restraint Analysis
- Opportunity Analysis
- Key Market Segments
- Report Scope
- You may also explore
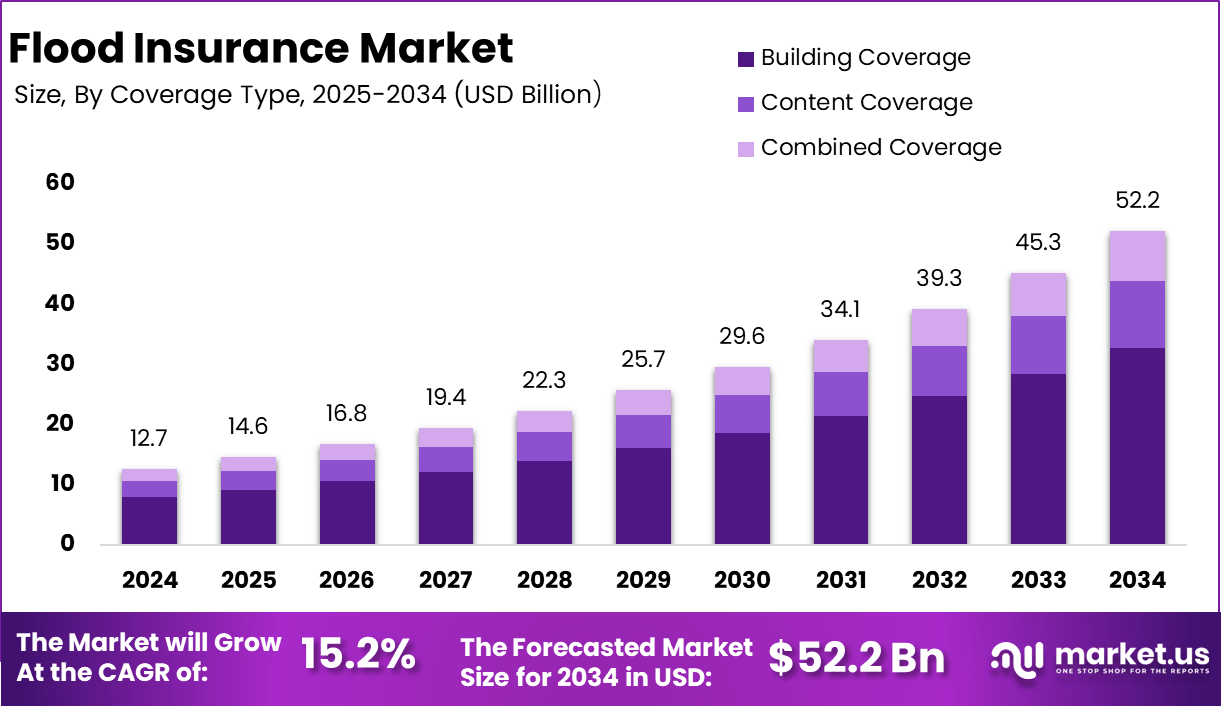
Flood Insurance Market Size
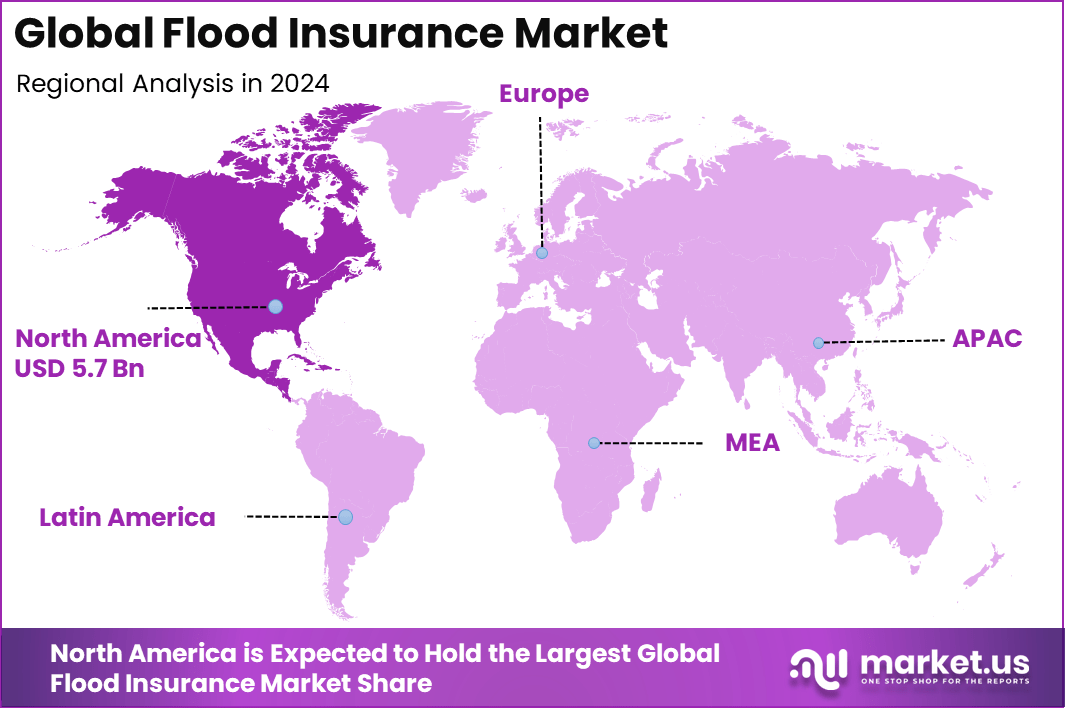
The global flood insurance market was valued at USD 12.7 billion in 2024 and is expected to reach approximately USD 52.2 billion by 2034, expanding at a CAGR of 15.2% during the forecast period from 2025 to 2034. In 2024, North America led the market with more than 45.3% share, generating around USD 5.7 billion in revenue.

The flood insurance market provides financial protection against property loss caused by flooding. Both residential and commercial property owners seek coverage to reduce financial risk from rising water levels, heavy rainfall, river overflow and coastal surges. As climate patterns shift and flood events become more frequent, more regions are evaluating the need for dedicated flood coverage. Insurers, government programs and private carriers play important roles in offering policies for homeowners, businesses and public infrastructure.
Unlock upto 60% off Christmas Sale deal on this research report @ https://market.us/purchase-report/?report_id=162470
Key Takeaways – Flood Insurance Market
- Content coverage led with 62.8%, as homeowners prioritize protection for personal belongings and household assets.
- The National Flood Insurance Program (NFIP) accounted for 58.3%, maintaining its role as the primary source of federally backed flood coverage.
- Direct sales channels captured 72.5%, reflecting strong preference for buying policies directly from insurers for clarity and flexibility.
- The U.S. flood insurance market reached USD 5.2 billion in 2024, growing at a solid 13.4% CAGR due to rising flood risks and awareness.
- North America held 45.3% of the global market, supported by advanced risk modeling and a mature insurance ecosystem.
Specific Country Statistics
| Country | Flood Insurance Coverage / Scheme | Key Statistics (2024-2025) |
|---|---|---|
| United States | National Flood Insurance Program (NFIP) | Only about 4% of homeowners have flood insurance; NFIP tracks claims and payouts |
| United Kingdom | Flood Re scheme | Supported over 660,000 households with subsidized premiums in 2025 |
| Japan | Public and private coverage | Approximately 75% of residential properties have flood coverage |
| Australia | Mandated coverage in Northern Territory | Coverage increased by 20–25% since 2018 |
| Germany | Natural disaster insurance (includes flood) | About 50% of homeowners covered |
| Canada | Expanded private market | Approximately 40% of homeowners have access to flood coverage |
| India | Microinsurance products | Coverage available for as little as $3 annually; pilot programs support crop loss compensation |
Emerging Trends
One clear trend is the expansion of private flood insurance, especially in regions where government programs cannot meet all coverage needs. Private insurers are offering new products with more flexible terms, broader coverage and modern underwriting practices. This growth is supported by improved access to risk data and more accurate flood models.
Another trend is the use of advanced climate and flood mapping technologies. Insurers increasingly rely on satellite imagery, hydrological models and predictive analytics to assess exposure more precisely. These tools allow insurers to price coverage more accurately and help property owners understand their real risk level even if they are outside traditional flood zones.
Growth Factors
A major growth factor is the rising frequency and severity of flood events. Climate-related increases in rainfall intensity, sea level rise and storm surges affect a wider population each year. As damages become more common and more costly, both individuals and businesses are seeking protection in the form of flood insurance.
Another growth factor is expanding urban development in flood-prone areas. Many cities continue to build residential and commercial structures near rivers, coasts and low-lying regions. As more assets are placed in these high-risk zones, insurance coverage becomes a practical requirement for lenders and local authorities.
By Coverage Type – Content Coverage (62.8%)
Content coverage led with 62.8%, showing that homeowners place high priority on protecting personal belongings and household assets against flood damage. Items such as furniture, electronics, appliances, and personal valuables are often at high risk during flood events, which increases demand for this type of coverage. Growth in this segment is supported by rising awareness of financial losses caused by interior damage rather than structural loss alone. Policyholders increasingly recognize that replacing household contents can be costly, making content coverage an essential part of flood insurance protection.
By Provider Type – National Flood Insurance Program (58.3%)
The National Flood Insurance Program accounted for 58.3%, maintaining its position as the primary source of flood coverage. Many homeowners rely on this program due to its standardized policies and broad availability across flood-prone regions. Its strong share is supported by government backing and long-standing trust among policyholders. The program continues to serve as a key option for properties that may face challenges in obtaining private flood insurance coverage.
By Distribution Channel – Direct Sales (72.5%)
Direct sales channels captured 72.5%, reflecting a strong preference for purchasing flood insurance directly from insurers. Customers value clear communication, transparent policy terms, and the ability to customize coverage based on specific property risks. The growth of direct channels is also supported by digital platforms that simplify policy comparison and purchase. Direct engagement helps insurers build stronger customer relationships and allows policyholders to manage coverage more efficiently.
United States – USD 5.2 Billion, CAGR 13.4%
The U.S. flood insurance market reached USD 5.2 billion in 2024 and is growing at a solid CAGR of 13.4%. This growth is driven by increasing frequency of flood events and rising awareness of climate-related risks. Homeowners and businesses are becoming more proactive in securing flood coverage as repair and recovery costs continue to rise. Regulatory attention and improved risk communication also support steady market expansion.

North America – 45.3%
North America held 45.3% of the global market, supported by advanced risk modeling and a well-developed insurance ecosystem. The region benefits from strong data analytics, flood mapping technologies, and established insurance infrastructure. High insurance penetration and increased focus on disaster preparedness continue to strengthen regional demand. As flood risks evolve, insurers in North America are adapting coverage options to meet changing customer needs.
Driver Analysis
A key driver is the high cost of flood damage. Flood recovery often involves extensive repair work, asset replacement and business interruption. Insurance helps reduce financial strain on property owners and reduces reliance on government disaster relief. This practical need encourages wider adoption of flood coverage.
Another driver is increasing public awareness. Updated hazard maps, government advisories and greater media coverage of recent flood disasters have helped people understand that flooding can affect regions beyond historically known floodplains. This awareness pushes more property owners to seek protection.
Restraint Analysis
A major restraint is affordability. In locations with high flood exposure, premiums can be difficult for many households to manage. This cost barrier results in low insurance uptake even in areas where flood risk is well documented.
Another restraint is limited insurer participation in certain regions. High uncertainty about extreme flood events can lead some insurers to avoid offering coverage in the most vulnerable zones. This limits consumer choice and increases reliance on government-supported programs.
Opportunity Analysis
There is a strong opportunity to design new, flexible insurance products. Approaches such as parametric flood insurance, micro-insurance or community-level coverage can improve affordability and widen access for households that cannot afford traditional plans.
Another opportunity is collaboration between insurers and public agencies. Joint programs can help expand risk awareness, improve local flood defences and promote resilient construction standards. These partnerships can support more sustainable long-term coverage in communities facing repeated flood exposure.
Key Market Segments
By Coverage Type
- Building Coverage
- Content Coverage
- Combined Coverage
By Policy Provider
- National Flood Insurance Program (NFIP)
- Private Flood Insurance
By Distribution Channel
- Direct Sales
- Agents and Brokers
Regional Analysis and Coverage
- North America
- US
- Canada
- Europe
- Germany
- France
- The UK
- Spain
- Italy
- Russia
- Netherlands
- Rest of Europe
- Asia Pacific
- China
- Japan
- South Korea
- India
- Australia
- Singapore
- Thailand
- Vietnam
- Rest of Latin America
- Latin America
- Brazil
- Mexico
- Rest of Latin America
- Middle East & Africa
- South Africa
- Saudi Arabia
- UAE
- Rest of MEA
Top Key Players in the Market
- Neptune Flood
- Pyron Group Insurance
- Advisory Insurance Brokers Limited
- FloodFlash Limited
- Insurance America LLC
- Sutcliffe Insurance Brokers Limited
- Nationwide Mutual Insurance Company
- Prizm Solutions Ltd
- Chubb Group
- Hylant Group, Inc.
- Reliant Assurance Brokers LLC
- JMG Insurance Corp
- Main Street America Insurance
- Assurant, Inc.
- The Hartford
- Others
Report Scope
| Report Features | Description |
|---|---|
| Market Value (2024) | USD 12.7 Bn |
| Forecast Revenue (2034) | USD 52.2 Bn |
| CAGR(2025-2034) | 15.2% |
| Base Year for Estimation | 2024 |
| Historic Period | 2020-2023 |
| Forecast Period | 2025-2034 |
You may also explore
- Business Process as a Service (BPaaS) Market
- Digital Smart Education Ecosystem Market
- Virtual Private Branch Exchange (PBX) System Market
- Virtual Security Appliance Market
- Purchase-Mortgage Market
- Big Data Finance Market
Discuss your needs with our analyst
Please share your requirements with more details so our analyst can check if they can solve your problem(s)