


Table of Contents
Cloud Data Observability Market Size
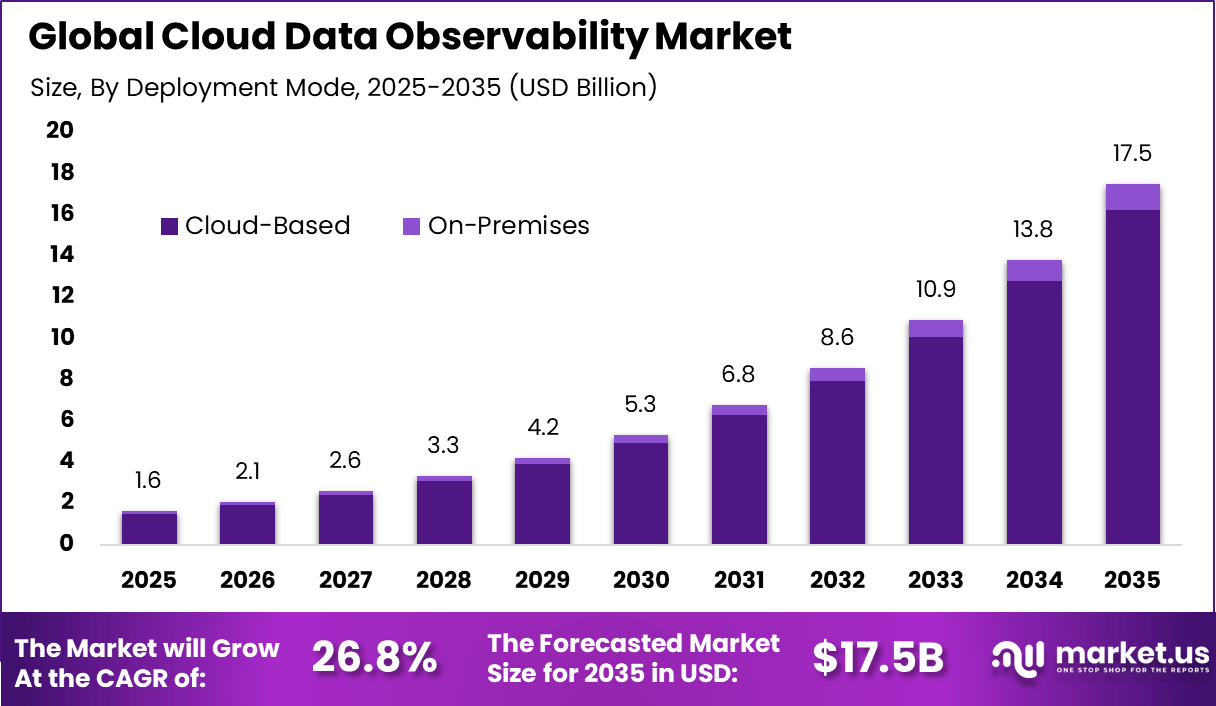
The Global Cloud Data Observability Market represents a significant growth opportunity, with an estimated USD 17.5 billion value creation potential by 2035. The market is expected to expand at a robust CAGR of 26.8%, driven by accelerating cloud migration, real-time data operations, and the rising need for resilient analytics pipelines. North America led the market, capturing more than 39.6% share and generating USD 0.6 billion in revenue, underscoring strong enterprise adoption and investor confidence in cloud-native data platforms.
The Cloud Data Observability Market refers to platforms and tools that help organizations monitor, understand, and trust data as it moves across cloud based systems. These solutions provide visibility into data freshness, volume, quality, lineage, and schema changes across pipelines and analytics environments. Cloud data observability is used to detect data issues early and prevent downstream business impact. It has become a core requirement as enterprises rely heavily on cloud data for decision making.
Modern data environments are highly distributed, with data flowing through multiple tools, teams, and cloud services. Traditional monitoring tools were designed for infrastructure and applications, not complex data pipelines. Industry studies show that more than 70% of organizations experience regular data quality incidents that affect reporting or analytics. This operational reality has made data observability a foundational layer in cloud data stacks.
One of the strongest driving factors is the rapid growth of cloud native data architectures. Data is now ingested from many sources and transformed continuously for analytics and machine learning use cases. As complexity increases, manual validation becomes impractical. Data observability tools help teams maintain control and reliability across these environments.
Another key driver is the rising business dependency on real time and near real time data. Decisions related to pricing, risk, marketing, and operations increasingly rely on automated data outputs. When data breaks, the business impact is immediate. This has pushed organizations to invest in proactive monitoring rather than reactive troubleshooting.
Top Market Takeaways
- Software and solutions accounted for 81.4% of adoption, as organizations increasingly relied on platforms that deliver full visibility into data health, reliability, and performance.
- Cloud based deployment led the market with a 92.7% share, supported by scalable infrastructure, seamless cloud integration, and growing demand for real time monitoring.
- Large enterprises represented 76.8% of total adoption, reflecting complex data environments, strict governance needs, and continuous reliability requirements.
- Data quality monitoring emerged as the leading application with a 44.3% share, highlighting strong emphasis on accuracy, consistency, and trust in analytics outcomes.
- IT and telecommunications accounted for 58.9% of market share, driven by high data velocity, distributed systems, and constant operational oversight.
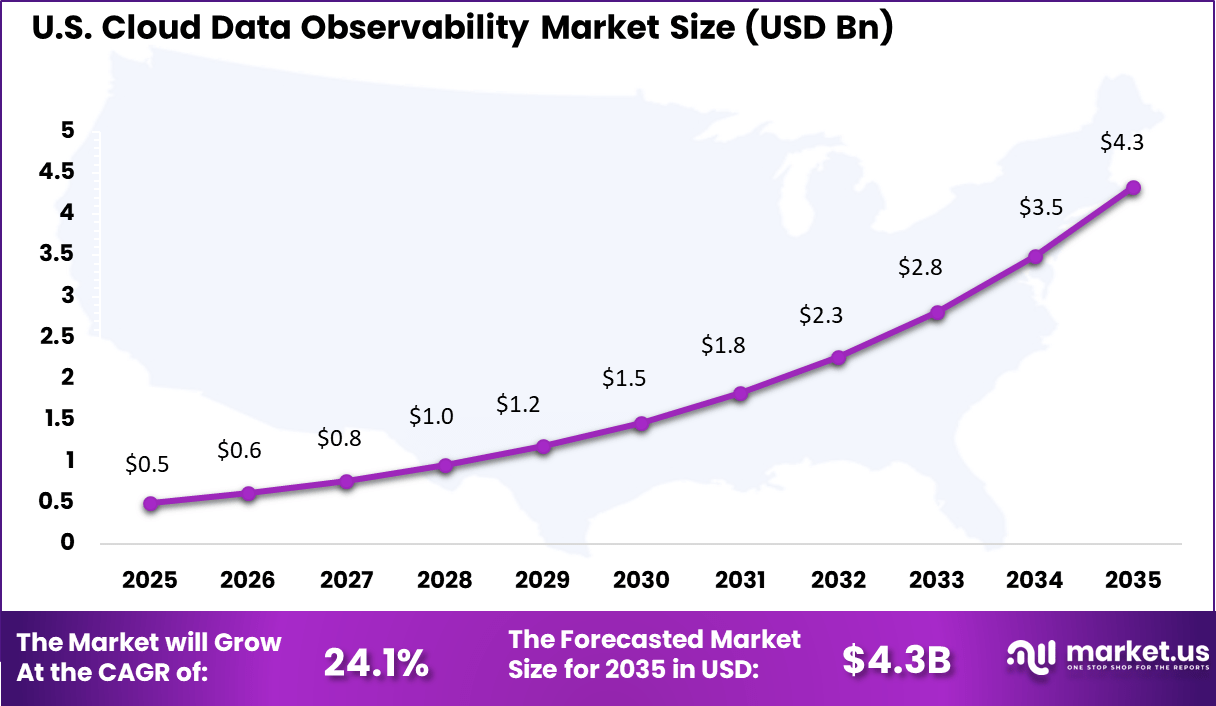
- North America held a 39.6% share, with the US valued at USD 0.58 billion and posting a CAGR of 24.11%, supported by early cloud adoption and mature data management practices.
Quick Market Facts
- By 2026, nearly 60% of organizations classify their observability practices as mature or expert, up from 41% in 2025.
- Only 7% of organizations remain in the early adoption stage, indicating rapid market advancement.
- Around 96% of IT leaders expect observability budgets to remain stable or increase through 2026.
- Large enterprises contribute 73.9% of overall adoption due to complex data landscapes and governance demands.
- Cloud based deployment continues to dominate, holding between 78.4% and 78.6% share due to scalability and centralized monitoring.
- Average incident resolution time has risen to 15 hours, compared with 9 hours in the previous year, reflecting growing system complexity.
- Nearly 91% of machine learning models decline in performance over time without continuous monitoring.
- Data teams spend close to 50% of their time resolving data related issues instead of focusing on analysis and innovation.
- Data quality issues impact roughly 31% of average business revenue.
- About 84% of organizations are actively consolidating tools to reduce observability platform overlap.
- Production use of OpenTelemetry has increased to 11%, up from 6% in 2025.
- Nearly 85% of organizations have standardized on OpenTelemetry to limit vendor dependency.
- Around 70% of enterprises apply observability to track agentic AI and model behavior in real time.
- Observability data is used by 68% of cybersecurity teams for incident response and audit monitoring.
Demand Analysis
Demand for cloud data observability is growing among enterprises operating large scale analytics platforms. Data teams are under pressure to deliver reliable insights faster while managing growing data volumes. Research indicates that data downtime can reduce productivity by more than 25% in analytics driven teams. This cost of failure directly supports adoption.
Demand is also increasing among mid sized organizations adopting cloud analytics for the first time. As these organizations scale, they encounter similar data reliability challenges as large enterprises. Observability tools help smaller teams manage complexity without expanding headcount. This broadens demand across organization sizes.
Increasing Adoption Technologies
Machine learning based anomaly detection is increasingly adopted within data observability platforms. These models learn normal data behavior and flag deviations automatically. This reduces reliance on static rules and manual thresholds. Technology driven detection improves accuracy and speeds response. Metadata driven monitoring technologies are also gaining adoption. By analyzing metadata rather than raw data, platforms can scale efficiently across large environments. This approach reduces performance overhead while maintaining deep visibility.
Metadata based observability has become a preferred architectural approach. Organizations adopt advanced observability technologies to reduce alert fatigue and false positives. Traditional rule based monitoring generates excessive noise. Intelligent anomaly detection focuses attention on meaningful issues. This improves team efficiency and response quality. Another reason is faster root cause analysis. Lineage and dependency mapping help teams understand where data issues originate. This shortens investigation time and reduces business disruption.
By Region
North America accounts for 39.6%, supported by strong cloud adoption across enterprises.
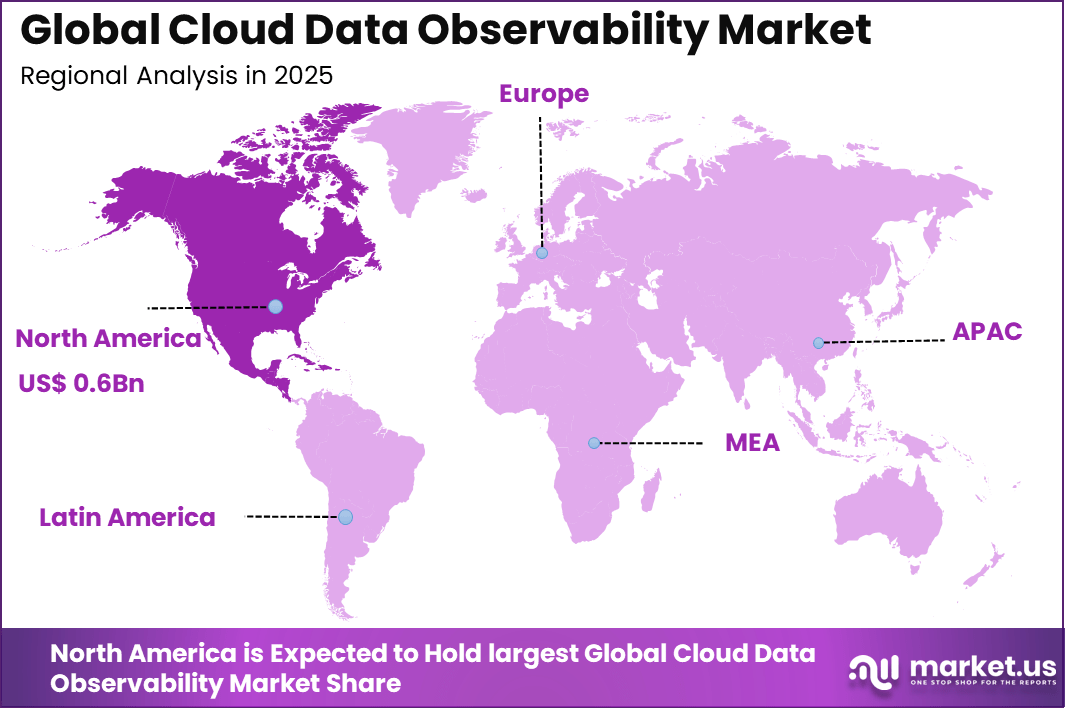
The United States reached USD 0.58 Billion with a CAGR of 24.11%, reflecting rapid market growth. Expansion is driven by data-driven business models.
Driver Analysis
A primary driver of the cloud data observability market is the rapid increase in distributed cloud data pipelines. Organizations ingest and process data from applications, customer platforms, sensors, and third party services across multiple cloud services. Traditional monitoring tools lack visibility into data level issues such as silent data failures or delayed updates. Cloud data observability addresses this gap by tracking data behavior continuously and identifying anomalies early.
Another important driver is growing business reliance on automated analytics and decision systems. Inaccurate or delayed data can directly affect revenue forecasting, customer experience, and compliance outcomes. Data teams are under pressure to ensure consistent data reliability. Observability tools provide real time insights that help teams detect issues before they propagate into business reports or models.
Restraint Analysis
A key restraint in the cloud data observability market is implementation and adoption complexity. Integrating observability tools into existing cloud data stacks requires coordination across data engineering, analytics, and platform teams. Organizations with fragmented architectures or limited documentation may face longer onboarding cycles. This complexity can delay value realization.
Another restraint is cost sensitivity, particularly for small and mid sized organizations. Cloud data observability solutions may increase compute usage and operational overhead. For teams with constrained budgets, demonstrating immediate return on investment can be challenging. This can slow adoption outside highly data mature enterprises.
Opportunity Analysis
A significant opportunity in the cloud data observability market lies in supporting artificial intelligence and machine learning pipelines. These systems require high quality, continuously updated data to perform reliably. Observability tools ensure training and inference data remains consistent and trustworthy. As AI adoption expands, demand for strong data reliability controls increases alongside it.
Another opportunity is the growing use of multi cloud and hybrid data strategies. Organizations operating across multiple cloud platforms need centralized visibility into data health. Observability solutions that provide unified monitoring across environments improve control and resilience. This capability aligns with enterprise scale cloud strategies.
Challenge Analysis
A major challenge for the cloud data observability market is managing alert relevance and signal quality. Excessive alerts can overwhelm data teams and reduce effectiveness. Observability platforms must prioritize issues based on impact and context. Intelligent alerting remains critical to usability and adoption.
Another challenge is translating technical observability metrics into business impact. Data freshness or schema issues must be communicated in terms that business stakeholders understand. Bridging the gap between technical signals and operational outcomes requires strong contextual mapping. Without this, value perception may remain limited.
Emerging Trends Analysis
An emerging trend in the cloud data observability market is tighter integration with data lineage and governance frameworks. Linking observability insights with lineage enables faster root cause analysis and accountability. This integration supports compliance and audit readiness. End to end visibility is becoming a standard requirement.
Another trend is increased automation through anomaly detection models. Machine learning techniques are being used to detect unusual data patterns without manual threshold configuration. Automated detection improves scalability and reduces reliance on constant human monitoring. This trend supports proactive data operations.
Growth Factors Analysis
One of the key growth factors for the cloud data observability market is the continued shift toward cloud first analytics strategies. As data workloads move to the cloud, pipeline complexity increases. Observability becomes essential to maintain reliability at scale. This structural shift supports sustained demand.
Another growth factor is rising organizational accountability for data quality. Business users increasingly expect accurate and timely data as a baseline standard. Data failures are no longer tolerated as technical issues alone. Cloud data observability supports transparency and ownership, reinforcing its role as a core data operations capability.
Key Market Segments
By Component
- Software/Solutions
- Services
By Deployment Mode
- Cloud-based
- On-premises
By Organization Size
- Large Enterprises
- Small and Medium-sized Enterprises
By Application
- Data Quality Monitoring
- Pipeline Performance Monitoring
- Cost and Usage Optimization
- Security and Compliance Monitoring
- Others
By End-User Industry
- IT and Telecommunications
- Banking, Financial Services, and Insurance
- Retail and E-commerce
- Healthcare
- Others
Top Key Players in the Market
- Datadog
- Splunk
- Dynatrace
- New Relic
- IBM
- Microsoft
- Amazon Web Services
- Observe
- Monte Carlo
- Acceldata
- Bigeye
- Anomalo
- Metaplane
- Soda
- Others
Report Scope
| Report Features | Description |
|---|---|
| Market Value (2025) | USD 1.6 Bn |
| Forecast Revenue (2035) | USD 17.5 Bn |
| CAGR(2026-2035) | 26.8% |
| Base Year for Estimation | 2025 |
| Historic Period | 2020-2024 |
| Forecast Period | 2026-2035 |
Discuss your needs with our analyst
Please share your requirements with more details so our analyst can check if they can solve your problem(s)