
Market Overview
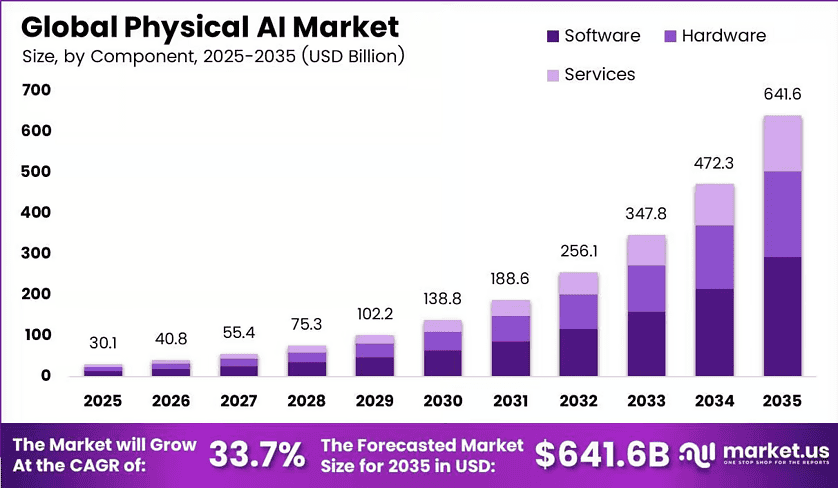
New York, NY – September 16, 2026 – The Global Physical AI Market reached USD 30.1 billion in 2025. Analysts expect the sector to touch USD 641.6 billion by 2035. Moreover, this path reflects a 33.7% CAGR from 2026 to 2035. North America dominated the market in 2025 with more than 48.0% share and about USD 14.4 billion in revenue.
Manufacturing, logistics, healthcare, and mobility firms need machines that sense conditions and perform physical work. The International Federation of Robotics reported 542,000 industrial robot installations during 2024. Consequently, the global operating stock reached 4.66 million units, up 9% year over year. This installed base creates steady demand for smarter control systems.
These deployments push spending toward computer vision, control software, edge processors, and simulation tools. Professional service robot sales neared 200,000 units and rose 9%. Additionally, embodied intelligence lets robots adapt to variable products instead of following fixed instructions. Therefore, adoption is widening across warehouses, hospitals, farms, and vehicle plants.
The International Federation of Robotics measured 204 industrial robots per 10,000 manufacturing workers in North America during 2024. The United States reached 307, while Canada reached 241. This density shows deep automation readiness. Consequently, US companies captured 68% of robot installations across the Americas.
Key Takeaways
- The Physical AI Market stood at USD 30.1 billion in 2025 and will reach USD 641.6 billion by 2035. The market will expand at a 33.7% CAGR from 2026 to 2035.
- Hardware led the component segment with a 57% share.
- Computer vision led the technology segment with a 43.0% share.
- Industrial robots led the robot type and form factor segment with a 39.0% share.
- Cloud-based AI led the deployment segment with a 51.2% share.
- Manufacturing and automotive led the application segment with a 24% share.
- North America led the market with a 48.0% share and USD 14.4 billion in revenue.
➤ Download Exclusive Sample Of This Premium Report (Including Full TOC, Table & Figures)- https://market.us/report/physical-ai-market/request-sample/
Market Segmentation
By Component
Hardware leads the component segment with a 57.0% share. Every embodied AI system needs processors, cameras, force sensors, motors, memory, power units, and safety controls. These parts carry high unit costs. Moreover, NVIDIA priced its Jetson T4000 module at USD 1,999 for orders of 1,000 units.
The module supplies 1,200 FP4 teraflops, 64 GB of memory, and a 70-watt setting. Such compute lets robots read many sensor streams and control motion instantly. However, software will grow fastest. NVIDIA created training data in 36 hours using GR00T-Dreams, replacing nearly three months of manual work.
By Technology
Computer vision holds a 43.0% share because machines must first read objects, people, and distances. Cameras also cost less than many special sensors. Additionally, NVIDIA reported that Holoscan Sensor Bridge cuts camera latency up to five times and reaches 17-millisecond glass-to-glass latency. Faster image flow means safer grasping and inspection.
By Robot Type and Form Factor
Industrial Robots lead with a 39.0% share because factories already run proven arms, controllers, and safety systems. The International Federation of Robotics valued installations at USD 16.7 billion in 2025. US plants added 38,000 units, an 11% rise. Therefore, suppliers can attach vision and adaptive motion to existing machines.
By Deployment
Cloud-based AI leads with a 51.2% share since teams need large clusters for model training and fleet management. Microsoft reported over 400 data centres across 70 regions in fiscal 2025. However, on-device processing grows fastest. Qualcomm’s QRB5165 delivers 15 trillion operations per second for local decisions.
By Application
Manufacturing and automotive lead with a 24.0% share because high-volume plants reward speed, quality, and uptime. US automotive plants installed 13,500 robots in 2025. Moreover, food industry adoption climbed 30% to nearly 3,000 installations. This spread shows intelligent automation now serves more than vehicle assembly lines.
Healthcare will grow fastest as hospitals seek accurate support systems. The World Health Organization expects a shortage of 11 million health workers by 2030. Consequently, demand rises for tools that cut routine tasks. Intuitive reported about 3,153,000 da Vinci procedures in 2025, up 18%, with 1,721 systems placed.
Regional Analysis
North America holds a 48.0% share and USD 14.4 billion in revenue. The United States supports this lead through chip design, hyperscale computing, and venture funding. Moreover, automotive, electronics, aerospace, and pharmaceutical plants deploy smart machines to close labour gaps and improve worker safety.
Asia Pacific grows fastest at a 31% CAGR. The region combines electronics supply chains, large factory output, and national automation programmes. Asia took 74% of new industrial robot deployments in 2024. Additionally, China installed 295,000 units, South Korea added 30,600, and India reached a record 9,100.
Drivers
Falling edge inference chip costs reshape robot unit economics. Semiconductor yields improve, so onboard compute now costs far less. This driver adds roughly 3.2% to the CAGR forecast. Consequently, mobile robots and cobots reach lower price points, and vendors shift toward recurring software and subscription revenue.
Warehouse labour shortages also push automation spending, adding about 2.1% to forecast CAGR. Operators struggle to staff picking, sorting, and movement tasks during peak demand. Therefore, they buy intelligent systems that show payback within roughly 12 to 18 months and steady throughput gains.
Use Cases
Factories use physical AI for flexible assembly and visual quality checks. Robots recognise mixed parts, adjust grip force, and flag surface defects during production. Moreover, line supervisors gain early warnings before faults reach customers. Therefore, plants protect output quality without adding extra manual inspection stations.
Hospitals apply intelligent machines to support movement, disinfection, rehabilitation support, and surgical assistance. Autonomous carts deliver linen, medicines, and samples between wards. Consequently, nurses spend more time with patients and less time on transport duties. Additionally, guided systems help therapists deliver repeatable rehabilitation sessions safely.
Business Opportunities
Humanoid robotics-as-a-service leasing opens fresh monetisation routes. Providers can bundle hardware, software updates, maintenance, and uptime guarantees into one monthly contract. Moreover, mid-sized logistics and manufacturing firms avoid heavy upfront capital spending. Therefore, managed service models can widen adoption well beyond large enterprise buyers.
Elder care and rehabilitation robotics remain a large white space. Ageing populations in Europe and Asia Pacific need daily assistance, mobility support, and therapy help. Additionally, care homes face steady staffing pressure. Consequently, vendors that meet safety and comfort standards can build durable regional demand.
Major Challenges
Robotics engineering talent remains scarce across major markets. Employers need people who understand control systems, mechanics, and applied machine learning together. Consequently, complex warehouse projects stretch far beyond planned timelines. However, low-code platforms, simulation training, and university partnerships help firms close this skills gap gradually.
The sim-to-real transfer gap also slows commercial rollouts. Models that perform well in simulation often fail against real lighting, friction, clutter, and human movement. Therefore, teams repeat costly field testing before approval. Additionally, fragmented interoperability standards make multi-vendor fleets harder to integrate and maintain.
Top Key Players in the Market
- NVIDIA Corporation
- Qualcomm Technologies, Inc.
- Tesla, Inc.
- Boston Dynamics
- ABB Ltd.
- FANUC Corporation
- KUKA AG
- Yaskawa Electric Corporation
- Siemens AG
- Amazon Robotics
- Intuitive Surgical, Inc.
- Figure AI, Inc.
- Agility Robotics
- Universal Robots
- Others
Conclusion
Physical AI moves from pilot projects into daily industrial use across factories, warehouses, hospitals, and farms. Hardware, computer vision, and cloud training platforms lead current spending, while on-device processing and service robots gain speed. North America keeps its lead, yet Asia Pacific expands fastest. However, talent gaps, supply constraints, and standards issues still shape realistic deployment timelines.
Discuss your needs with our analyst
Please share your requirements with more details so our analyst can check if they can solve your problem(s)