
Market Overview
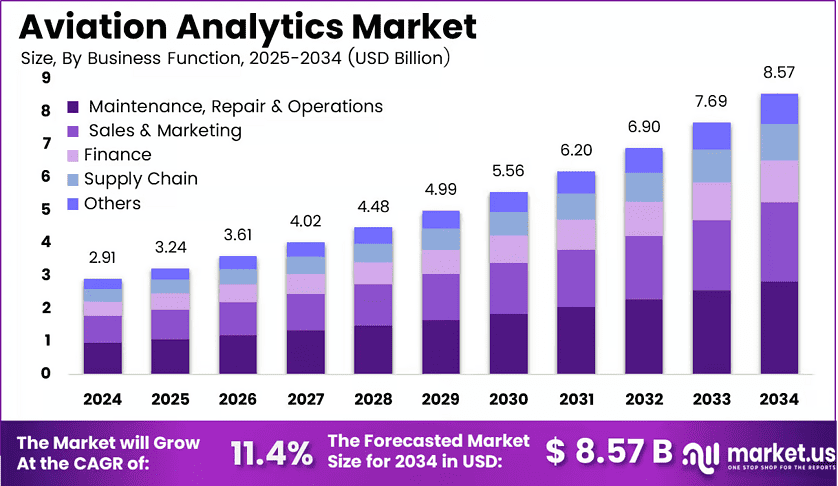
New York, NY – September 23, 2026 – The Global Aviation Analytics Market reached USD 2.9 billion in 2024. Analysts expect the market to reach USD 8.5 billion by 2034. Therefore, aviation data analytics should grow at an 11.4% CAGR between 2025 and 2034. North America led the market with a 34% share and USD 0.99 billion in 2024 revenue.
Airlines and airports face heavier passenger loads, wider networks, and tighter cost targets. According to IATA, carriers are expected to fly 4.99 billion travelers and earn USD 979 billion during 2025. Passenger revenue alone reached about USD 693 billion. Consequently, operators need sharper tools for pricing, fuel use, and service planning.
ACI World expects airport passenger traffic to reach 10.2 billion in 2026, up 3.9% from 2025. Busier terminals create more bookings, sensor readings, and baggage events. Therefore, air transport operators must process far larger record volumes to keep flights moving on time.
Analytics platforms convert these records into practical decisions. Systems build demand forecasts, raise risk alerts, schedule maintenance, and guide fare changes. Moreover, loyalty programs and cargo systems feed the same models. Airlines and ground teams then act on shared numbers instead of separate reports. Large carrier networks, advanced airport systems, and heavy AI spending support this lead. Additionally, ACI World forecast 2.1 billion North American airport passengers for 2025, which sustains constant analytics demand.
Key Takeaways
- The Aviation Analytics Market stood at USD 2.9 billion in 2024 and will reach USD 8.5 billion by 2034. The market will grow at an 11.4% CAGR during 2025 to 2034.
- Software led the component segment with a 62.1% share.
- Airlines led the end-user segment with a 49.7% share.
- Customer analytics led the application segment with a 26.8% share.
- Maintenance, repair and operations led the business function segment with a 33.2% share.
- North America led the market with a 34% share and USD 0.99 billion in revenue.
➤ Download Exclusive Sample of This Premium Report (Including Full TOC, Table & Figures)- https://market.us/report/aviation-analytics-market/request-sample/
Market Segmentation
By Component
Software holds 62.1% of the component segment. Carriers and airports want one view of flights, crews, aircraft, and costs. According to SITA, airlines spent USD 37 billion on IT in 2024, while airports spent USD 8.9 billion. That budget shows how central platforms have become to daily operations.
Services form the fastest-growing sub-segment. Aviation firms need help with system integration, cloud moves, cybersecurity, and staff training. Moreover, SITA reported that 74% of airlines and 72% of airports expected higher IT spending within two years. Rising budgets therefore pull more consulting and support work into the market.
By Application
Customer analytics leads with 26.8% because traveler behavior shapes ticket revenue and service costs. IATA found that 71% of passengers preferred online or app booking in 2024, while 53% chose airline-owned channels. These direct channels reveal trip intent, so carriers personalize fares with far better accuracy.
Fuel management grows fastest as prices swing and emission rules tighten. IATA expected sustainable aviation fuel output of 2 million tonnes in 2025, only 0.7% of total fuel use. Tight supply added an estimated USD 4.4 billion to the fuel bill. Consequently, airlines fund burn-reduction tools quickly.
By Business Function
Maintenance, repair and operations holds 33.2% because aircraft safety depends on timely checks. Boeing expects the commercial fleet to pass 50,000 aircraft by 2045, with around 44,000 new deliveries. Larger fleets mean more inspections. Therefore, engineering teams rely on analytics to predict failures and plan labor.
Boeing also projects demand for 710,000 new technicians through 2044, which shows a serious staffing gap. Sales and marketing grows fastest, supported by digital retailing. An IATA survey found 81% of airline executives had adopted New Distribution Capability, enabling personalized offers and stronger ancillary sales.
By End-User
Airlines dominate with 49.7% because they price seats, plan routes, and manage crews every day. IATA reported passenger demand growth of 5.3% in 2025 and a record load factor of 83.6%. Full aircraft leave little slack, so carriers need precise data to avoid costly disruption.
Airports grow fastest as crowds press on terminals, gates, and security lanes. ACI World expects 18.8 billion airport passengers by 2045, with annual growth near 3.4%. Building new terminals takes years. Consequently, operators adopt smart gates, digital identity, and live analytics to stretch existing capacity.
Regional Analysis
North America leads with a 34% share and USD 0.99 billion in revenue. IATA projected USD 11.3 billion in regional airline net profit for 2026, equal to USD 9.80 per passenger. Healthy margins give carriers room to fund revenue management and predictive maintenance programs.
Asia Pacific offers strong growth potential. China handled 770.1 million airline passenger trips and 10.17 million tonnes of cargo in 2025, gains of 5.5% and 13.3%. Its airports processed 1.529 billion passenger movements. Therefore, regional carriers invest heavily in forecasting and operations tools.
Drivers
Predictive maintenance adoption adds an estimated 2.8% to CAGR. Onboard sensors stream engine and avionics data continuously. Machine-learning models then flag likely faults before aircraft-on-ground events occur. Consequently, carriers gain better dispatch reliability, faster turnarounds, and smarter use of spare parts and technicians.
Recovering air traffic contributes another 2.1%, mainly across Asia Pacific and the Middle East. Higher flight counts create more schedule conflicts, delays, and pricing decisions each day. Moreover, fleet digitization and IoT sensors add 1.6%, since connected aircraft supply the raw data these models need.
Use Cases
Airlines apply analytics to protect revenue during disruption. Systems watch weather, crew hours, and aircraft position together. Controllers then reroute flights, swap aircraft, and rebook travelers faster. Consequently, carriers cut compensation costs and keep schedules closer to plan during heavy delay periods.
Airports use similar tools to smooth passenger flow through terminals. Sensors and gate data show queue build-up at check-in, security, and boarding areas. Managers then shift staff and open lanes before crowds grow. Therefore, travelers wait less, and existing terminals handle more daily departures.
Business Opportunities
Sustainable fuel optimization remains largely untapped. Most carriers still run these programs as small pilots rather than full deployments. However, upcoming CORSIA and emissions trading deadlines will force wider action. Vendors that link fuel blending, burn tracking, and reporting can therefore win early contracts.
Low-cost carriers across Africa and Southeast Asia form a second opening. These airlines want lean tools priced for tight margins. Moreover, usage-based pricing lets vendors earn from embedded analytics without heavy upfront fees. Urban air mobility operators create an added long-term market for similar platforms.
Major Challenges
Talent shortages slow project delivery across the sector. Few engineers combine aerospace knowledge with applied machine learning skills. General data scientists rarely understand airworthiness directives or ARINC data standards. Consequently, airlines struggle to staff teams and stretch rollout timelines well beyond original plans.
Legacy avionics integration creates a second hurdle. Older aircraft systems produce data in formats that modern platforms cannot read easily. Moreover, manufacturers use different standards, so teams rebuild connections for each fleet type. Cybersecurity risk across connected networks adds further caution and cost.
Top Key Players in the Market
- Accelya
- General Electric
- IBM Corporation
- IGT Solutions Pvt. Ltd.
- MU Sigma
- OAG Aviation Worldwide Limited
- Oracle Corporation
- Ramco Systems
- SAP SE
- SAS Institute Inc.
Conclusion
The aviation analytics market shows steady long-term momentum. Rising passenger traffic, fuel pressure, and safety duties push airlines and airports toward data-led decisions. Software, customer analysis, and maintenance functions lead demand, while North America holds the top position. However, talent gaps and legacy system barriers still slow progress. Therefore, vendors offering simple integration and clear savings should gain ground.
Discuss your needs with our analyst
Please share your requirements with more details so our analyst can check if they can solve your problem(s)