


Table of Contents
- What is App Revenue?
- Editor’s Choice
- General App Revenue Statistics
- App Revenue Statistics by Platform
- Gaming App Revenue Statistics
- App Revenue Statistics – Social Media Apps
- Entertainment App Revenue Statistics
- App Revenue Statistics – Highest Grossing Apps of All Time
- Top Grossing Apps by Category
- Grossing Apps and Games in the United States
- Top Grossing Apps and Games in the United Kingdom
- Top Grossing Apps and Games in India
- Recent Developments
- Wrap Up
- FAQs
App Revenue Statistics: In the digital age, mobile applications have become a significant part of our daily lives, offering a wide range of services, entertainment, and productivity tools.
With the increasing popularity of smartphones and tablets, the app industry has experienced tremendous growth, leading to substantial app revenue generation.

What is App Revenue?
App revenue refers to the total income generated by mobile applications through various monetization models, such as in-app purchases, subscriptions, advertising, paid downloads, and more.
Developers and app publishers strive to create successful and profitable apps, leveraging different strategies to maximize their revenue potential.
Editor’s Choice
- The Global Application Development Software Market is estimated to be worth USD 210.5 billion in 2023 and is projected to be valued at USD 1,381.4 billion in 2033. Between 2024 and 2033, the market is expected to register a growth rate of 20.7%.
- In 2022, global app revenue reached $142 billion, showing a significant increase from previous years.
- The Apple App Store accounted for approximately 65% of global app revenue, while Google Play contributed around 35%.
- Gaming apps continue to dominate app revenue, accounting for over 70% of total app revenue in 2022.
- In-app purchases (IAPs) remain the primary source of app revenue, representing around 50% of total app revenue.
- The global mobile advertising market is projected to reach $400 billion by 2026, driven by the increasing adoption of in-app advertising.
- Subscription-based apps have experienced significant growth, with subscription revenue reaching $13 billion in 2021, marking a 34% year-over-year increase.
- Asia-Pacific is the largest mobile app market in terms of revenue, accounting for approximately 40% of global app revenue.
- China is the leading country in terms of app revenue, followed by the United States and Japan.
(Source: Sensor Tower, App Annie, Statista)

General App Revenue Statistics
- G-Play Store app revenue in the 3rd quarter of 2022: $10.38 billion worldwide.
- Apple App Store revenue from in-app purchases, subscriptions, and premium apps in the most recent quarter: $21.1 billion.
- Apple App Store revenue decreased by 3% compared to the previous quarter.
- iOS game revenues increased by 8.9% to $52.28 billion in 2021.
- iOS accounted for 57.6% of all mobile gaming revenue.
- Number of apps available in the Apple App Store during the second quarter of 2022: 2.18 million.
- The availability of apps on iOS increased by 5% compared to the previous quarter.
- The global monthly in-app spend per user, per app, is $0.50. The average in-app purchase per user differs for Android and iOS users. The average prices are 0.47 cents for Android and $1 for iPhone owners.
- 98% of Google Play revenue comes from “freemium” apps (Bank My Cell)
- The market had around 1 million low-quality apps as of 2023.
- TikTok wins the race when it comes to non-game app revenue.
(Source: Sports Lens, Business of Apps & Macro Trends)
App Revenue Statistics and Trends
- App Store app downloads grew by 1.99%, while Google’s decreased by 11.6% in 2022. (Business of Apps & Mobile Marketing Reads)
- The top app categories by consumer spending worldwide are games, entertainment, and social networking. (Source: Business of Apps)
- Most consumer spending on apps goes to gaming apps through in-app purchases. However, in 2023, paid subscriptions as an app revenue stream will become more prevalent in non-game apps.
- Just over 62% of all mobile users in the US have games on their smartphones. (Idea Usher)
- On Google Play, 97% of all apps are free. (Source: Statista)
- There were 87,000 new applications in February 2023 alone on the Google Play Store. (Source: Statista)
- Estimations suggest 50% of non-game apps and an even higher 79% of game apps use in-app purchases alone or as a part of their monetization stream mix. (Source: Business of Apps)

App Revenue Statistics by Platform
- The mobile app revenue estimate is expected to reach $613 billion by 2025. (Statista)
- There will be roughly 3.553 million apps for Android devices on the Google Play Store in 2023. Conversely, there are roughly 1.642 million apps in the Apple App Store.
- The applications market is growing, as there is a prediction that the mobile app revenue estimation will reach $935 billion by 2023.
- Mobile apps help businesses increase brand recognition, boost client loyalty, and gain profit.
- 142.6 billion apps were downloaded from the iOS App Store in 2022. (Business of Apps)
- The total downloads of all apps from the iOS App Store were 142.6 billion, while there were 110 billion app downloads from the Google Play Store in 2022.
- By 2026, consumer spending on the App Store will be approximately $161 billion. (Statista)
- By 2026, consumer spending on Google Play and App Stores will total $233 billion. An estimated 5% of users spend money on in-app purchases. Most of them are based in Asia, North America, and Europe.
- App sales statistics show that 48.2% of all mobile app earnings are from In-app purchases. Paid app revenue comes second, with 37.8% of the total.
Gaming App Revenue Statistics
- Gaming apps dominate the app market in terms of revenue and popularity.
- The global mobile gaming market was valued at $77.2 billion in 2020. (Source: Newzoo)
- In 2020, mobile gaming accounted for 58% of the total gaming market revenue. (Source: Newzoo)
- The average mobile gamer spends 3 hours and 40 minutes per week playing games. (Source: Newzoo)
- The number of mobile gamers worldwide is projected to reach 3.3 billion by 2023. (Source: Newzoo)
- In 2020, the top-grossing mobile game worldwide was “PUBG Mobile,” generating $1.16 billion in revenue. (Source: Sensor Tower)
- Freemium games, which are free to download but offer in-app purchases, are the most popular revenue model in gaming apps.
- In-app purchases in gaming apps accounted for 48.2% of all mobile app earnings. (Source: Business of Apps)
- The average revenue per daily active user (ARPDAU) for gaming apps is around $0.32.
- The top gaming genres in terms of revenue include strategy, role-playing, and action games.
- Gaming apps often rely on in-app advertisements, sponsorships, and collaborations with brands to generate additional revenue.
- Popular gaming apps create opportunities for esports, live streaming, and community engagement, contributing to their revenue streams.
- App Annie estimates that mobile gaming revenue will reach $120 billion by 2023. (Source: Sensor Tower)

App Revenue Statistics – Social Media Apps
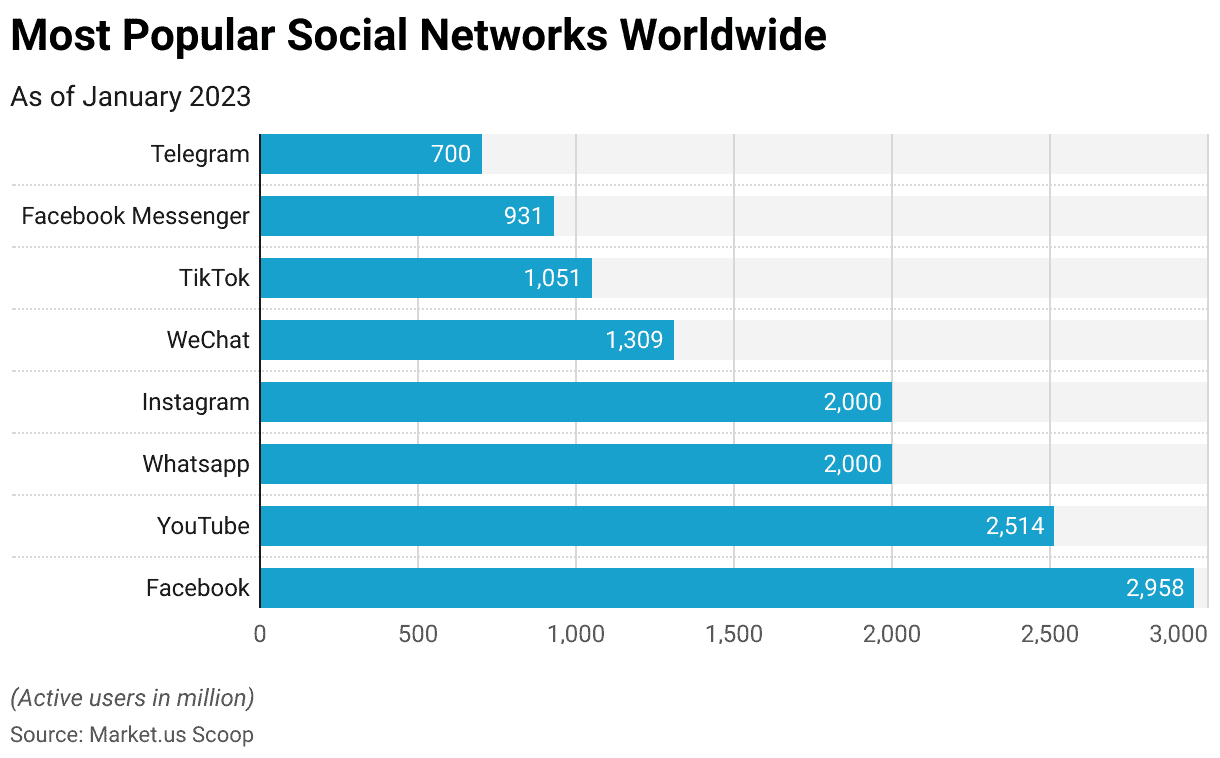
- Facebook generated $101.5 billion in advertising revenue in 2020.
- The average revenue per user (ARPU) for Facebook in Q4 2020 was $10.14. (Source: Statista)
- Instagram is projected to generate $595 million in mobile ad revenue in 2021.
- In 2020, Instagram had 1.16 billion monthly active users worldwide. (Source: Statista)
- Snapchat’s global advertising revenue is expected to reach $2.62 billion in 2021.
- In Q2 2021, Snapchat had 293 million daily active users. (Source: Snap Inc.)
- Twitter’s advertising revenue reached $3.72 billion in 2020. (Source: Statista)
- The average revenue per user (ARPU) for Twitter in Q4 2020 was $3.47. (Source: Statista)
- TikTok’s global advertising revenue is estimated to reach $4.45 billion in 2021.
- In 2020, TikTok was downloaded over 850 million times worldwide. (Source: Sensor Tower)
- LinkedIn’s revenue reached $8.05 billion in 2020. (Source: Statista)
- In 2020, LinkedIn had over 756 million registered members. (Source: LinkedIn)
- Pinterest’s global advertising revenue is projected to reach $1.58 billion in 2021.
- In Q2 2021, Pinterest had 454 million monthly active users. (Source: Pinterest)
- YouTube’s advertising revenue was $19.77 billion in 2020. (Source: Statista)
- The average revenue per user (ARPU) for YouTube in Q4 2020 was $9.86. (Source: Statista)
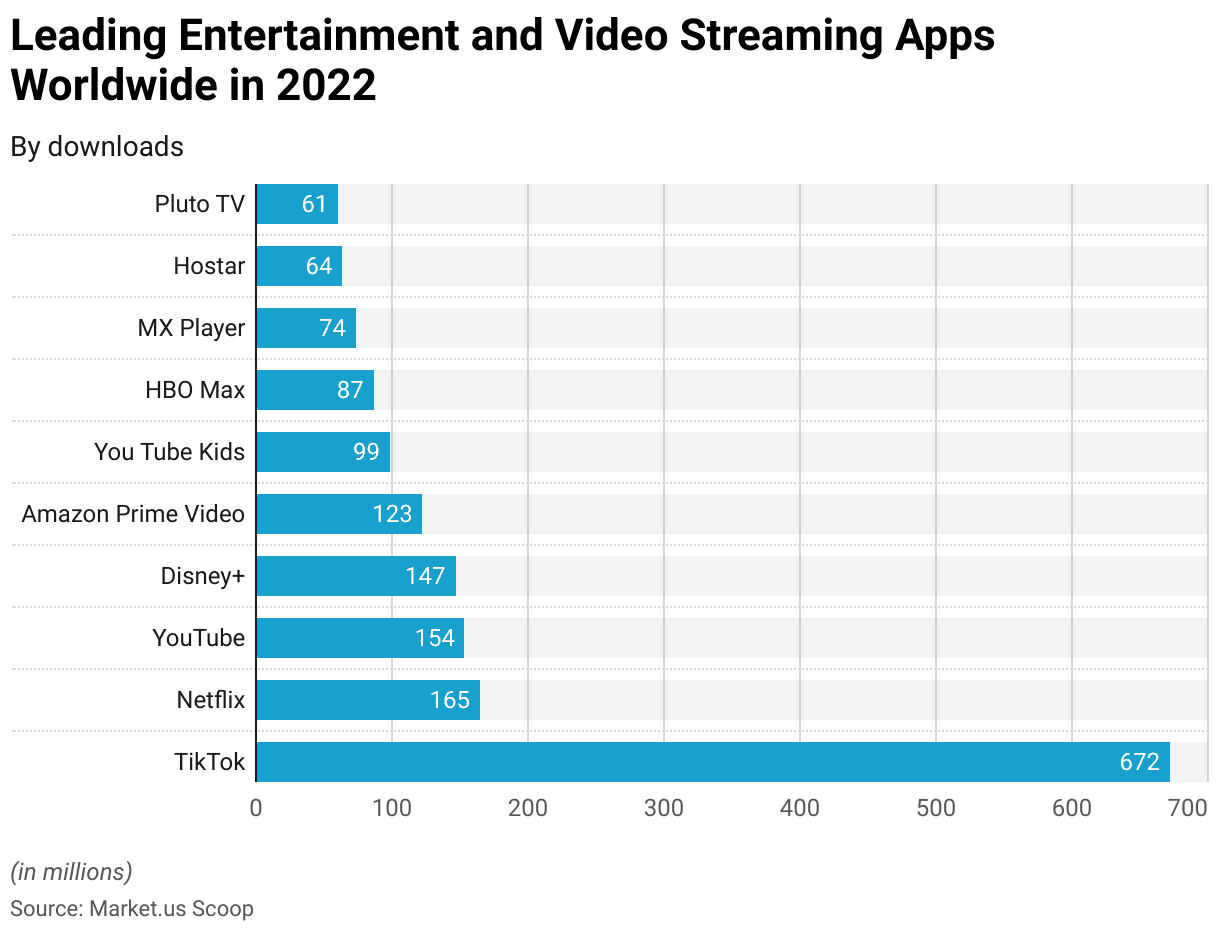
Entertainment App Revenue Statistics
- Entertainment apps, particularly streaming services, have seen significant revenue growth in recent years. For example, in 2020, Netflix generated $25 billion in revenue globally. (Source: Statista)
- Subscription models are the primary revenue source for many entertainment apps. In 2021, subscription revenue from mobile video streaming apps reached $12.2 billion globally. (Source: App Annie)
- In addition to subscriptions, in-app advertising is another revenue stream for entertainment apps. In 2020, global mobile app ad spending in the entertainment category amounted to $16.8 billion. (Source: Statista)
- In 2020, users spent an average of 18.7 hours per month on video streaming apps globally. (Source: App Annie)
- Entertainment apps, such as streaming services and gaming platforms, have experienced significant download numbers. For instance, in 2020, Netflix’s mobile app was downloaded over 223 million times worldwide. (Source: Sensor Tower)
- The popularity and revenue of entertainment apps vary across regions. For example, in the United States, the top-grossing entertainment app in 2020 was Disney+, while in China, iQiyi was a leading entertainment app. (Source: App Annie)
- There can be variations in revenue and downloads between different app stores. For example, in the first half of 2021, video streaming apps on the App Store generated $8.3 billion in consumer spending, while on Google Play, they generated $4.5 billion. (Source: App Annie)
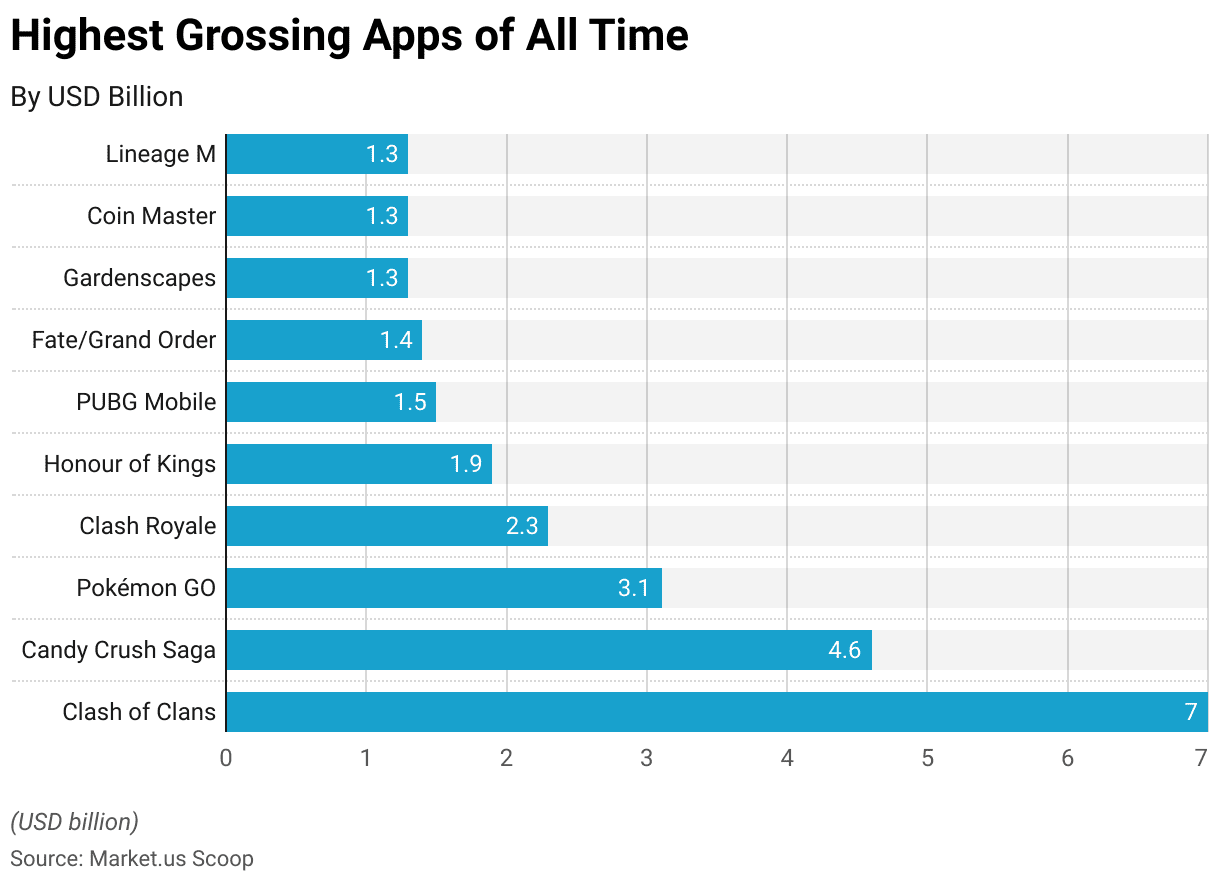
App Revenue Statistics – Highest Grossing Apps of All Time
- Clash of Clans has generated a revenue of $7 billion.
- Candy Crush Saga holds a revenue of $4.6 billion.
- Pokémon GO has earned $3.1 billion in revenue.
- Clash Royale has achieved a revenue of $2.3 billion.
- Honor of Kings has generated a revenue of $1.9 billion.
- PUBG Mobile holds a revenue of $1.5 billion.
- Fate/Grand Order has earned $1.4 billion in revenue.
- Gardenscapes and Coin Master have both generated a revenue of $1.3 billion.
- Lineage M also holds a revenue of $1.3 billion.
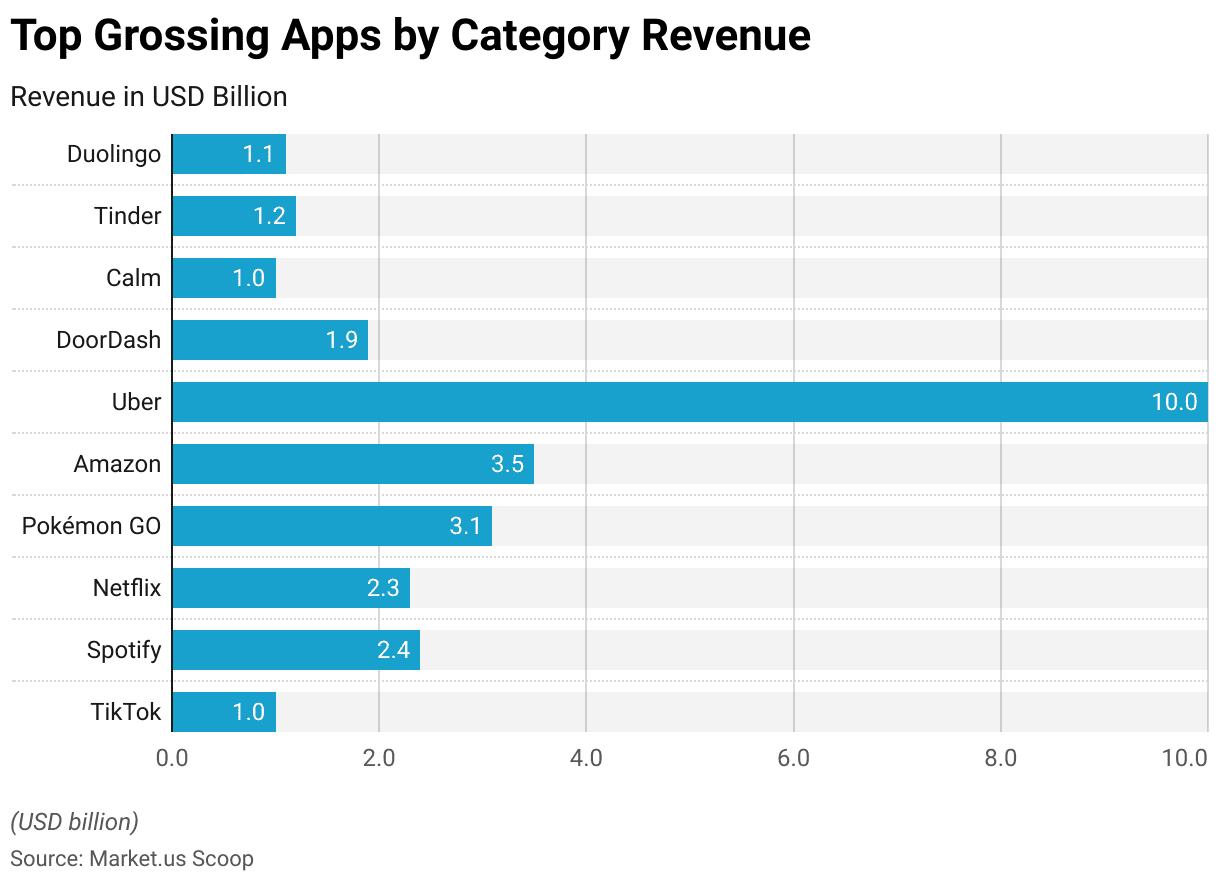
Top Grossing Apps by Category
- TikTok, in the category of Social Media, has generated a revenue of $1 billion.
- Spotify, a music streaming app, holds a revenue of $2.4 billion.
- Netflix, in the category of Video Streaming, has achieved a revenue of $2.3 billion.
- Pokémon GO, in the gaming category, has earned $3.1 billion in revenue.
- Amazon, in the Shopping category, has generated a revenue of $3.5 billion.
- Uber, a ride-sharing app, holds a revenue of $10 billion.
- DoorDash, in the Food Delivery category, has achieved a revenue of $1.9 billion.
- Calm, a fitness app, has generated a revenue of $1 billion.
- Tinder, in the category of Dating, has earned $1.2 billion in revenue.
- Duolingo, in the Education category, holds a revenue of $1.1 billion.
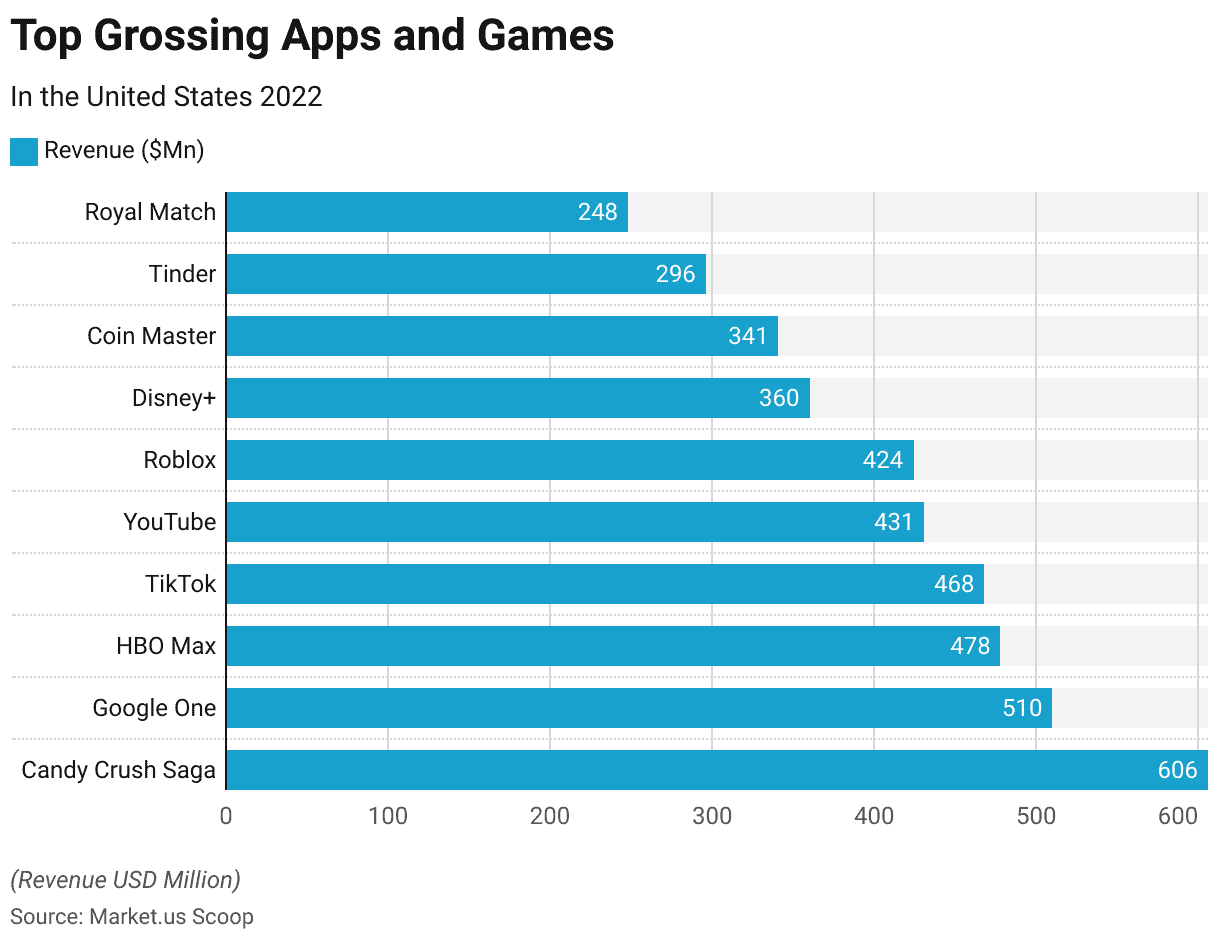
Grossing Apps and Games in the United States
- Candy Crush Saga generated a revenue of $606 million, making it the top-earning app.
- Google One earned $510 million in revenue, securing the second position in the ranking.
- HBO Max, with $478 million in revenue, held the third spot among the highest-earning apps.
- TikTok generated $468 million in revenue, placing it fourth in terms of app revenue.
- YouTube earned $431 million, making it one of the top revenue-generating apps.
- Roblox secured $424 million in revenue, ranking it among the top-earning apps.
- Disney+ generated $360 million in revenue, making it a significant contributor to app earnings.
- Coin Master earned $341 million in revenue, placing it among the top revenue-generating apps.
- Tinder, with $296 million in revenue, was another significant app in terms of earnings.
- Royal Match generated $248 million in revenue, contributing to the overall app revenue. (Source: businessofapps)
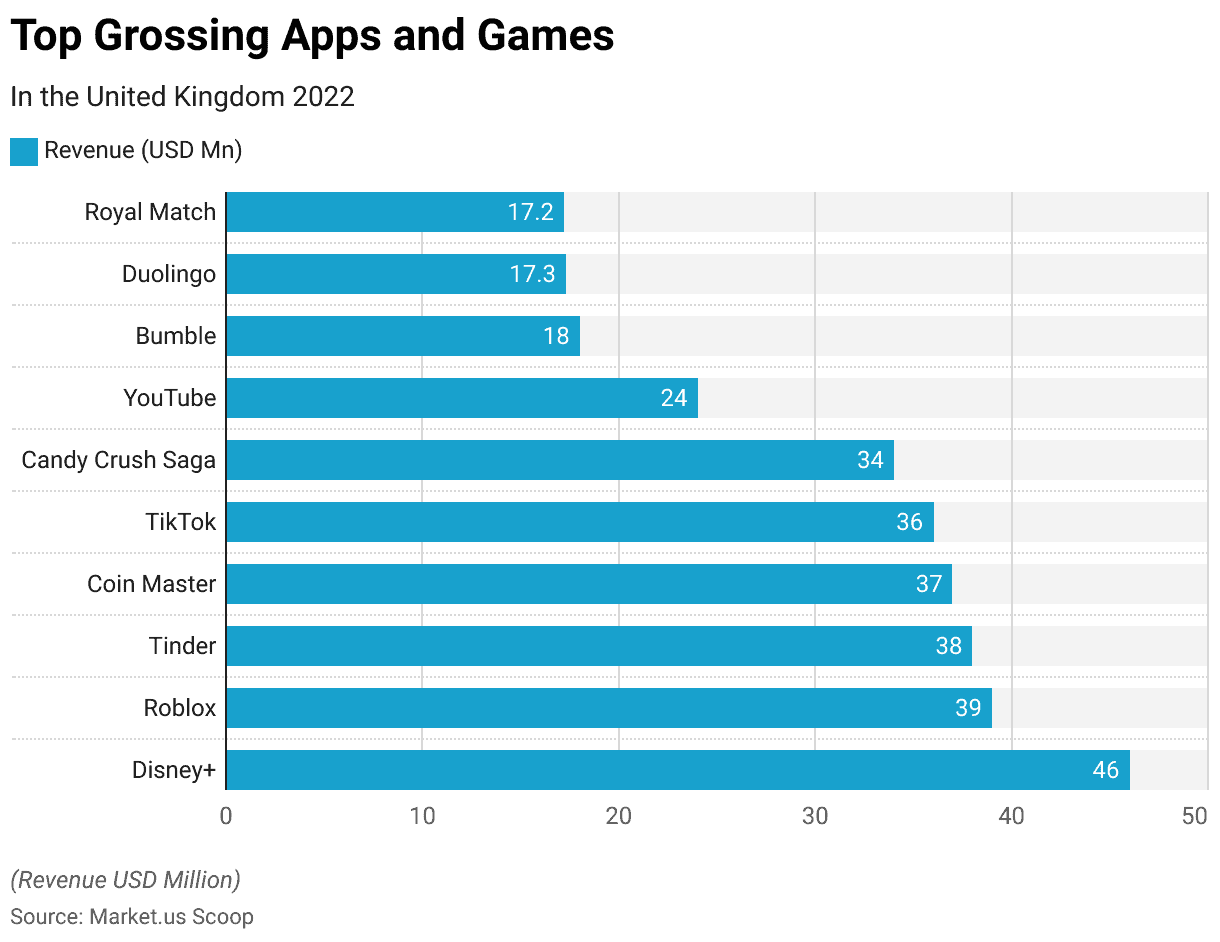
Top Grossing Apps and Games in the United Kingdom
- Disney+ generated 46 million in revenue, making it the highest-earning app on the list.
- Roblox followed closely behind with 39 million in revenue.
- Tinder ranked third, with a revenue of 38 million.
- Coin Master generated 37 million in revenue, securing the fourth position.
- TikTok earned 36 million in revenue, placing it fifth on the list.
- Candy Crush Saga, a popular mobile game, generated 34 million in revenue.
- YouTube, the well-known video-sharing platform, earned 24 million in revenue.
- Bumble, a dating app, had a revenue of 18 million.
- Duolingo, an app for language learning, earned 17.3 million in revenue.
- Royal Match, a mobile puzzle game, closely followed with a revenue of 17.2 million.
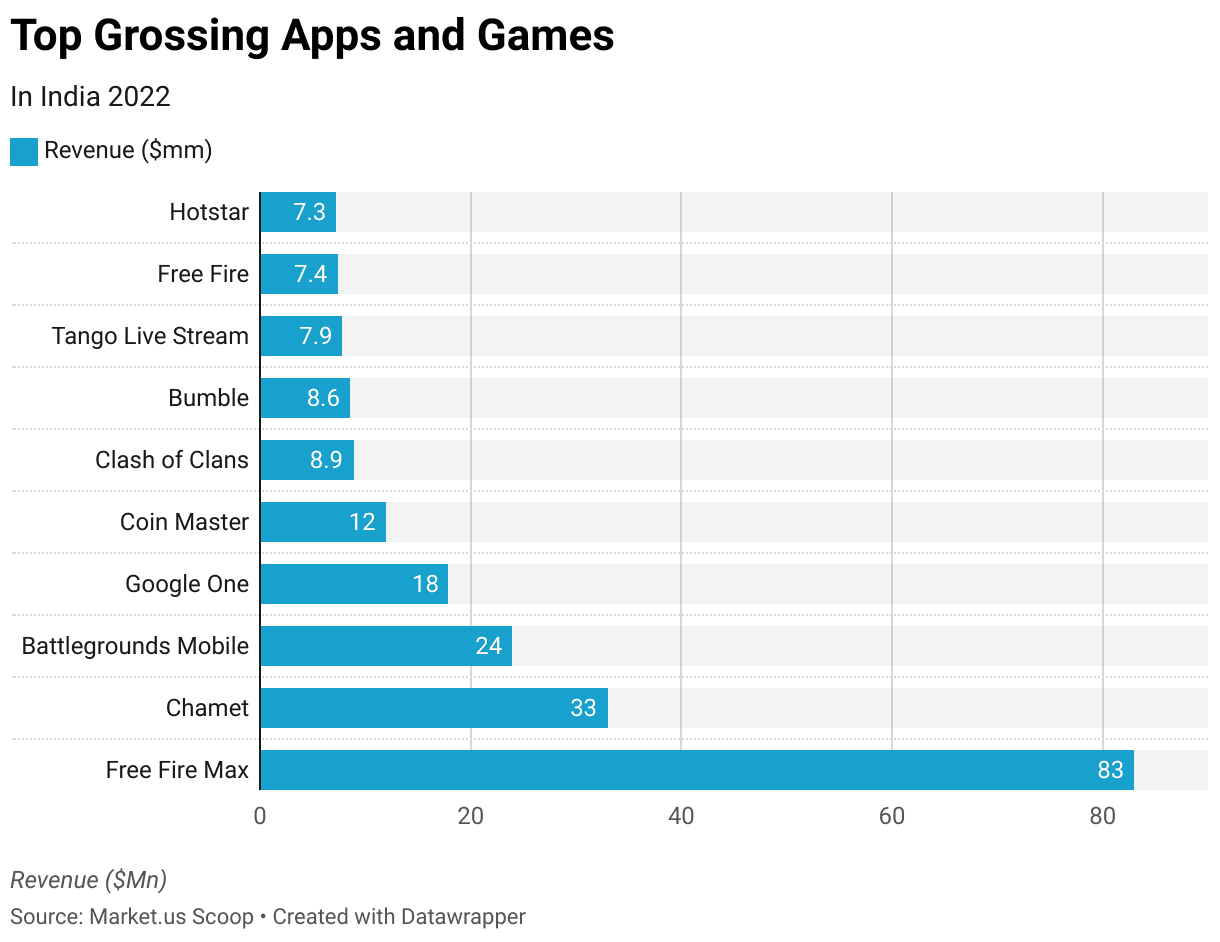
Top Grossing Apps and Games in India
- Free Fire Max generated the highest revenue of $83 million.
- Chamet earned a revenue of $33 million.
- Battlegrounds Mobile generated a revenue of $24 million.
- Google One earned a revenue of $18 million.
- Coin Master generated a revenue of $12 million.
- Clash of Clans earned a revenue of $8.9 million.
- Bumble generated a revenue of $8.6 million.
- Tango Live Stream earned a revenue of $7.9 million.
- Free Fire generated a revenue of $7.4 million.
- Hotstar earned a revenue of $7.3 million.
Recent Developments
Decline in App Install Ad Spending:
- The global downturn affected mobile app user acquisition budgets, leading to a 6% decline in app install ad spending, reaching $82 billion in 2023. The decline was more pronounced for Android platforms compared to iOS.
Top-Selling Apps of 2023:
- Popular apps such as Minecraft, Hitman: Sniper, and Fruit Ninja Classic topped the charts with millions of downloads, showcasing continued consumer interest and spending in established mobile games.
Fitness Apps Revenue Growth:
- Fitness apps like Peloton and MyFitnessPal have seen significant revenue streams by offering subscription-based services alongside free features supported by advertising. This sector continues to grow as it combines fitness tracking with mobile technology.
Cash App’s Expanding Revenue:
- Cash App’s revenue growth has been robust, with significant contributions from features like Bitcoin trading and stock trading. The platform generated $10.6 billion in revenue in 2022 and continued to see growth into 2023.
In-app Purchases and Subscription Models:
- In-app purchases remain a substantial revenue source, accounting for 48.2% of total app revenue in 2020. Subscription models also showed strong growth, with a 34% increase year-on-year, reaching approximately $13 billion in 2020.
Wrap Up
The app industry has witnessed remarkable revenue growth, driven by the increasing popularity of smartphones and tablets.
App revenue is generated through various monetization models, including in-app purchases, subscriptions, advertising, and paid downloads.
Gaming apps have consistently dominated app revenue, followed by social media, entertainment, and productivity apps.
The United States, China, and Japan are among the leading countries in terms of app revenue. However, app revenue trends can vary across regions and evolve as consumer preferences and market dynamics change.
The app industry continues to offer significant opportunities for developers and businesses to generate revenue and capitalize on the ever-expanding digital landscape.
FAQs
What is app revenue?
App revenue refers to the total income generated by mobile applications through various monetization models, such as in-app purchases, subscriptions, advertising, paid downloads, and more.
Which app category generates the highest revenue?
Gaming apps consistently generate the highest revenue, accounting for a significant portion of the overall app revenue. Other categories like social media, entertainment, and productivity apps also contribute to app revenue but to a lesser extent.
What is the global app revenue trend?
The global app revenue has been steadily increasing over the years. In 2022, it reached $142 billion, demonstrating substantial growth compared to previous years.
How much revenue is generated by in-app purchases?
In-app purchases have been a significant revenue driver for many apps. On average, in-app purchases contribute around 50% of total app revenue, but the exact percentage can vary depending on the app category and target audience.
Discuss your needs with our analyst
Please share your requirements with more details so our analyst can check if they can solve your problem(s)