


Table of Contents
- Introduction
- Editor’s Choice
- Global Electric Vehicle Charging Infrastructure Market Overview
- Type of EV Chargers & Its Installation
- Average Revenue Per Electric Vehicle Charging Station
- Electric Vehicle Charging Infrastructure in Different Nations
- Electric Vehicle Charging Infrastructure Trends
- Critical Investments in EV Charging Infrastructure
Introduction
According to Electric Vehicle (EV) Charging Infrastructure Statistics, Electric Vehicle (EV), Charging Infrastructure comprises charging stations and associated components, enabling convenient battery recharging for EVs. It includes Level 1, 2, and DC Fast Charging (Level 3) options to meet charging requirements.
Critical elements like stations, connectors, power distribution systems, and software management systems facilitate charging. These stations are strategically positioned in residential areas, public venues like malls and workplaces, and along highways to accommodate diverse charging needs.
Charging networks oversee station operations and provide services such as station location and payment processing via mobile apps or RFID cards. A solid grasp of these fundamental principles is essential for stakeholders engaged in the planning, execution, and administration of EV charging infrastructure, advancing the transition toward sustainable transportation.
Editor’s Choice
- By 2032, the global electric vehicle (EV) charging infrastructure market revenue is expected to reach USD 224.8 billion.
- In the electric vehicle (EV) charging infrastructure market, commercial applications hold the majority share, accounting for 63.40%.
- In 2022, China led the charge with 360,000 installations, pushing its total number of slow chargers past the 1 million mark.
- By 2028, the average revenue per station is expected to quadruple to 4.03 thousand U.S. dollars, indicating substantial growth and investment in the global electric vehicle charging infrastructure market.
- In 2020, South Korea had an electric vehicle stock-to-public charging point ratio of 2:1, indicating one public charging point available for every two electric vehicles.
- The Netherlands has 19.3 charging stations, indicating a robust infrastructure to support electric vehicle adoption.
- The Infrastructure Investment and Jobs Act (IIJA), passed in November 2021, marks the most substantial infrastructure investment since the New Deal. It earmarks $7.5 billion for EV charging infrastructure, $5 billion for electric school buses, and $5.6 billion for electric transit buses, aiming to promote electric transportation.
Global Electric Vehicle Charging Infrastructure Market Overview
Global Electric Vehicle Charging Infrastructure Market Size
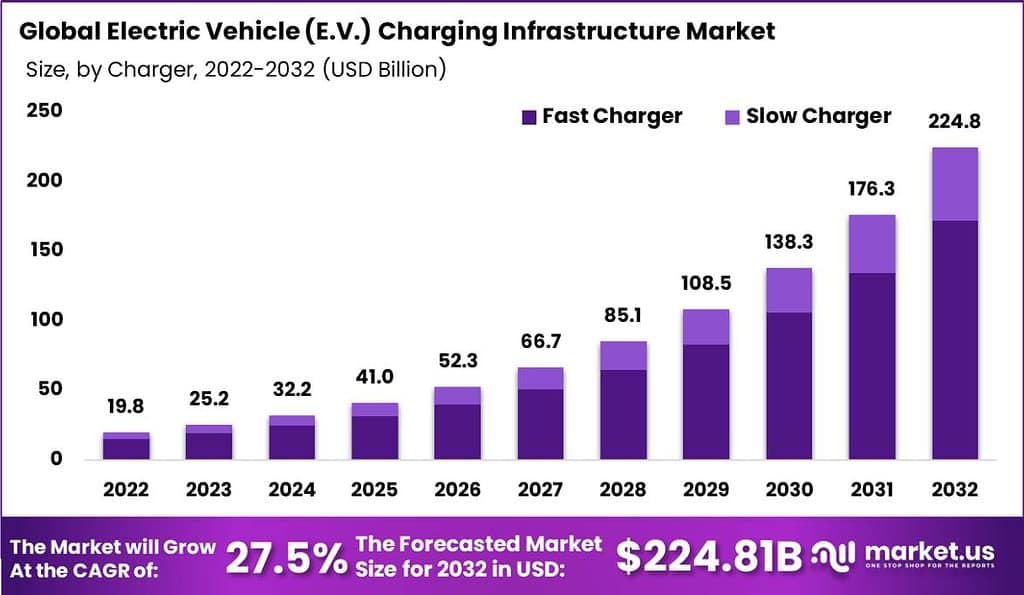
- The global electric vehicle (EV) charging infrastructure market revenue has shown a steady upward trend over the years at a CAGR of 27.5%, reflecting the increasing adoption of electric vehicles worldwide.
- In 2022, the market revenue stood at USD 19.8 billion, which grew to USD 25.2 billion in 2023, indicating significant growth within just one year.
- Substantial growth is anticipated beyond 2027, with revenues forecasted to surpass USD 85.1 billion in 2028, USD 108.5 billion in 2029, and USD 138.3 billion in 2030.
- By 2031 and 2032, the market is expected to see even more significant growth, with revenues reaching USD 176.3 billion and USD 224.8 billion, respectively.

Electric Vehicle Charging Infrastructure Market Size – By Charger
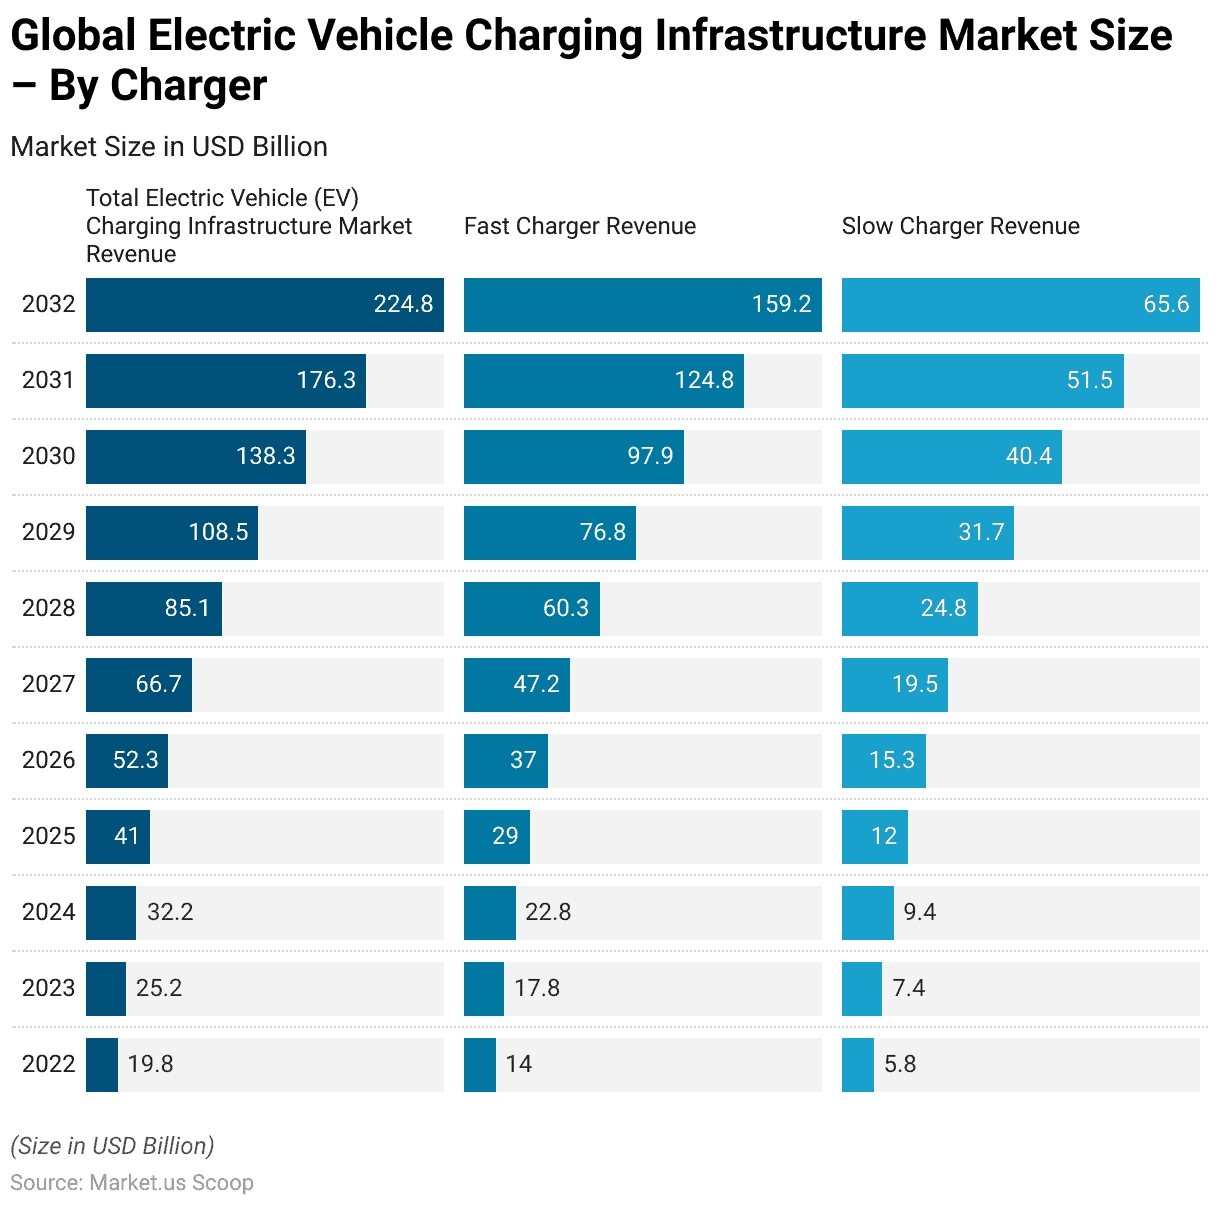
- In 2022, the total market revenue amounted to USD 19.8 billion, with fast chargers contributing USD 14.0 billion and slow chargers generating USD 5.8 billion.
- This trend continued to escalate, with revenues reaching USD 32.2 billion in 2024, marking a substantial increase across both fast and slow charger segments.
- By 2032, the market is projected to soar to USD 224.8 billion, reflecting the escalating demand for electric vehicles and the corresponding need for comprehensive charging infrastructure.
- Fast chargers are expected to dominate the market, with revenue estimated at USD 159.2 billion, while slow chargers are forecasted to contribute USD 65.6 billion.
Electric Vehicle Charging Infrastructure Market Share – By Application
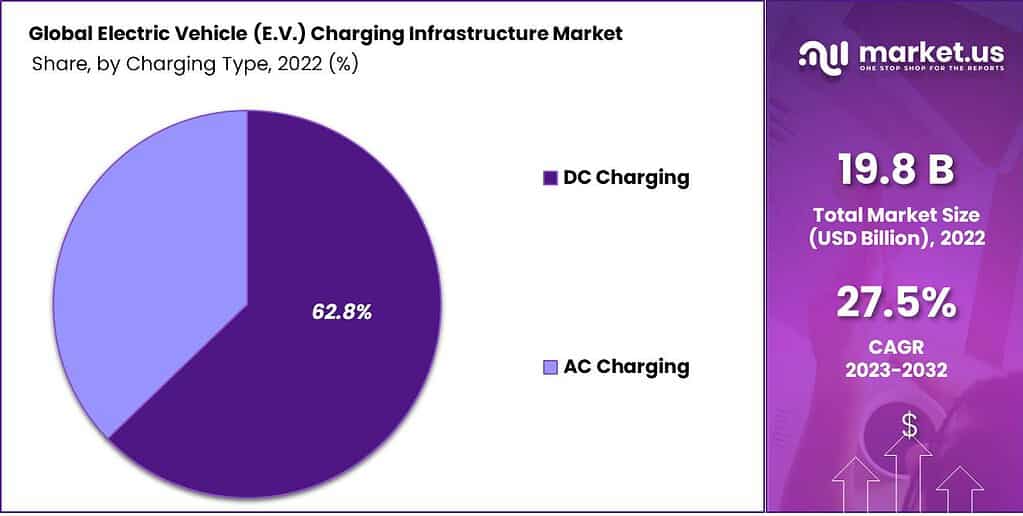
- In the electric vehicle (EV) charging infrastructure market, commercial applications hold the majority share, accounting for 63.40%.
- On the other hand, residential applications contribute to 36.60% of the market share. Residential charging stations are typically installed at home, allowing EV owners to charge their vehicles overnight conveniently.
Type of EV Chargers & Its Installation
Slow Chargers
- In 2022, the global rollout of public slow charging stations hit a milestone, with over 600,000 units installed worldwide.
- Notably, China led the charge with 360,000 installations, pushing its total number of slow chargers past the 1 million mark.
- By the end of the year, China accounted for more than half of all public slow chargers globally.
- Europe followed closely, boasting 460,000 slow chargers, a 50% increase from the previous year.
- Among European countries, the Netherlands emerged as the frontrunner with 117,000 units, followed by France with around 74,000 and Germany with 64,000.
Fast Chargers
- In 2022, the global number of fast chargers increased by 330,000, with nearly 90% of this growth coming from China.
- This expansion of fast charging infrastructure is crucial for addressing the challenge of limited access to home chargers, especially in densely populated urban areas, and it aligns with China’s objectives to accelerate electric vehicle deployment.
- Despite leading the global count with 760,000 fast chargers, more than 70% of China’s fast chargers are concentrated in just ten provinces.
- In Europe, the total inventory of fast chargers exceeded 70,000 by the end of 2022, marking a 55% increase from 2021.
Average Revenue Per Electric Vehicle Charging Station
- From 2018 to 2028, the average revenue per electric vehicle charging station worldwide has notably increased, reflecting the growing demand for electric vehicle infrastructure.
- In 2018, the average revenue per station was 0.87 thousand U.S. dollars, slightly decreasing to 0.84 thousand U.S. dollars in 2019.
- Subsequently, from 2021 onwards, there was a significant uptick in average revenue per station, reaching 0.93 thousand U.S. dollars in 2021 and climbing steadily.
- By 2028, the average revenue per station had more than quadrupled to 4.03 thousand U.S. dollars, indicating substantial growth and investment in the global electric vehicle charging infrastructure market.

Electric Vehicle Charging Infrastructure in Different Nations
The ratio of Electric Vehicle Stock to Public Charging Points in Selected Countries
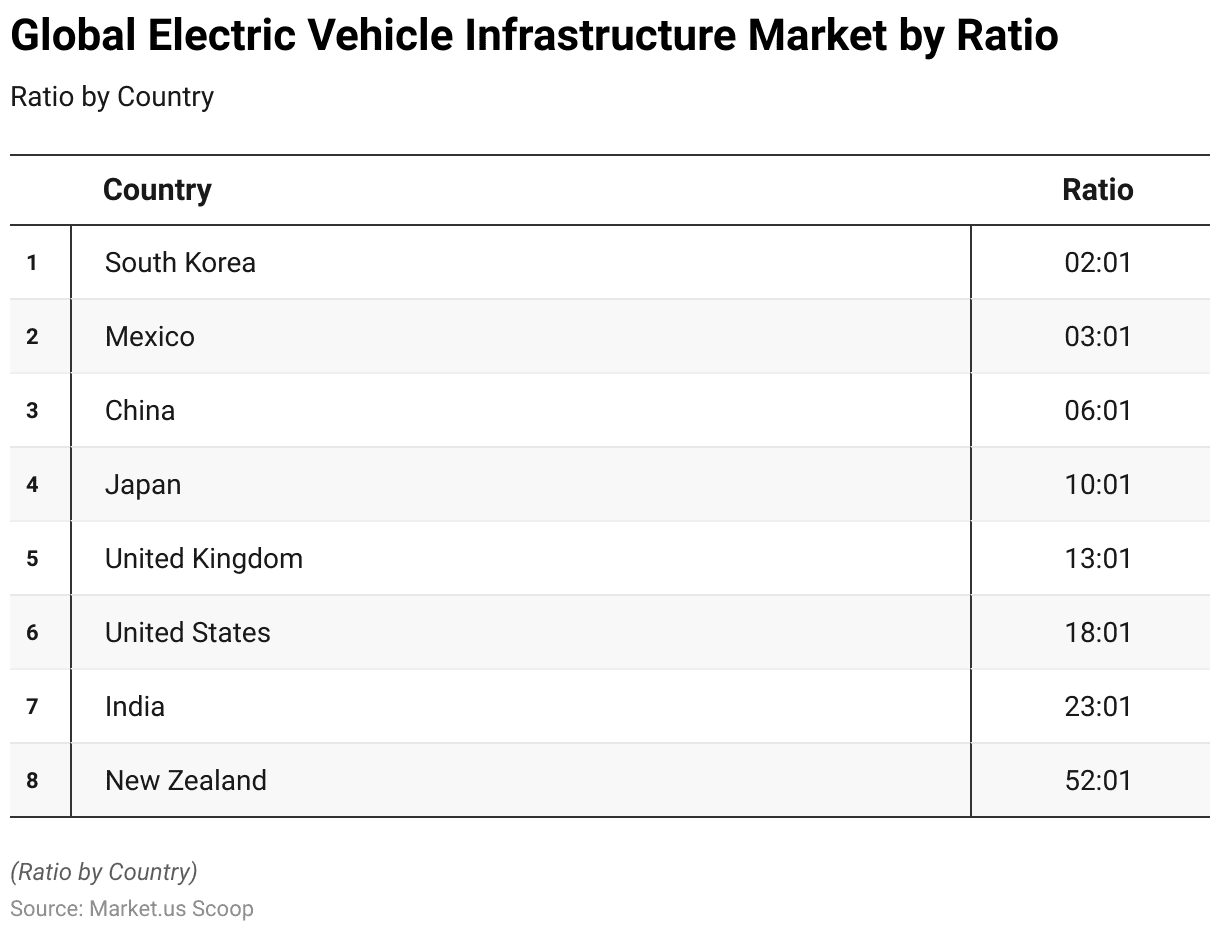
- In 2020, the ratio of electric vehicle stock to public charging points varied significantly among selected countries.
- South Korea had a ratio of 2:1, indicating that for every two electric vehicles, one public charging point was available.
- Mexico’s ratio stood at 3:1, while China’s ratio was 6:1, suggesting a higher availability of charging infrastructure relative to the number of electric vehicles in these countries.
- Japan exhibited a ratio of 10:1, followed by the United Kingdom with a ratio of 13:1, indicating a relatively lower density of public charging points compared to the electric vehicle stock.
- The United States had a ratio of 18:1, suggesting a significant gap between the number of electric vehicles and available charging infrastructure.
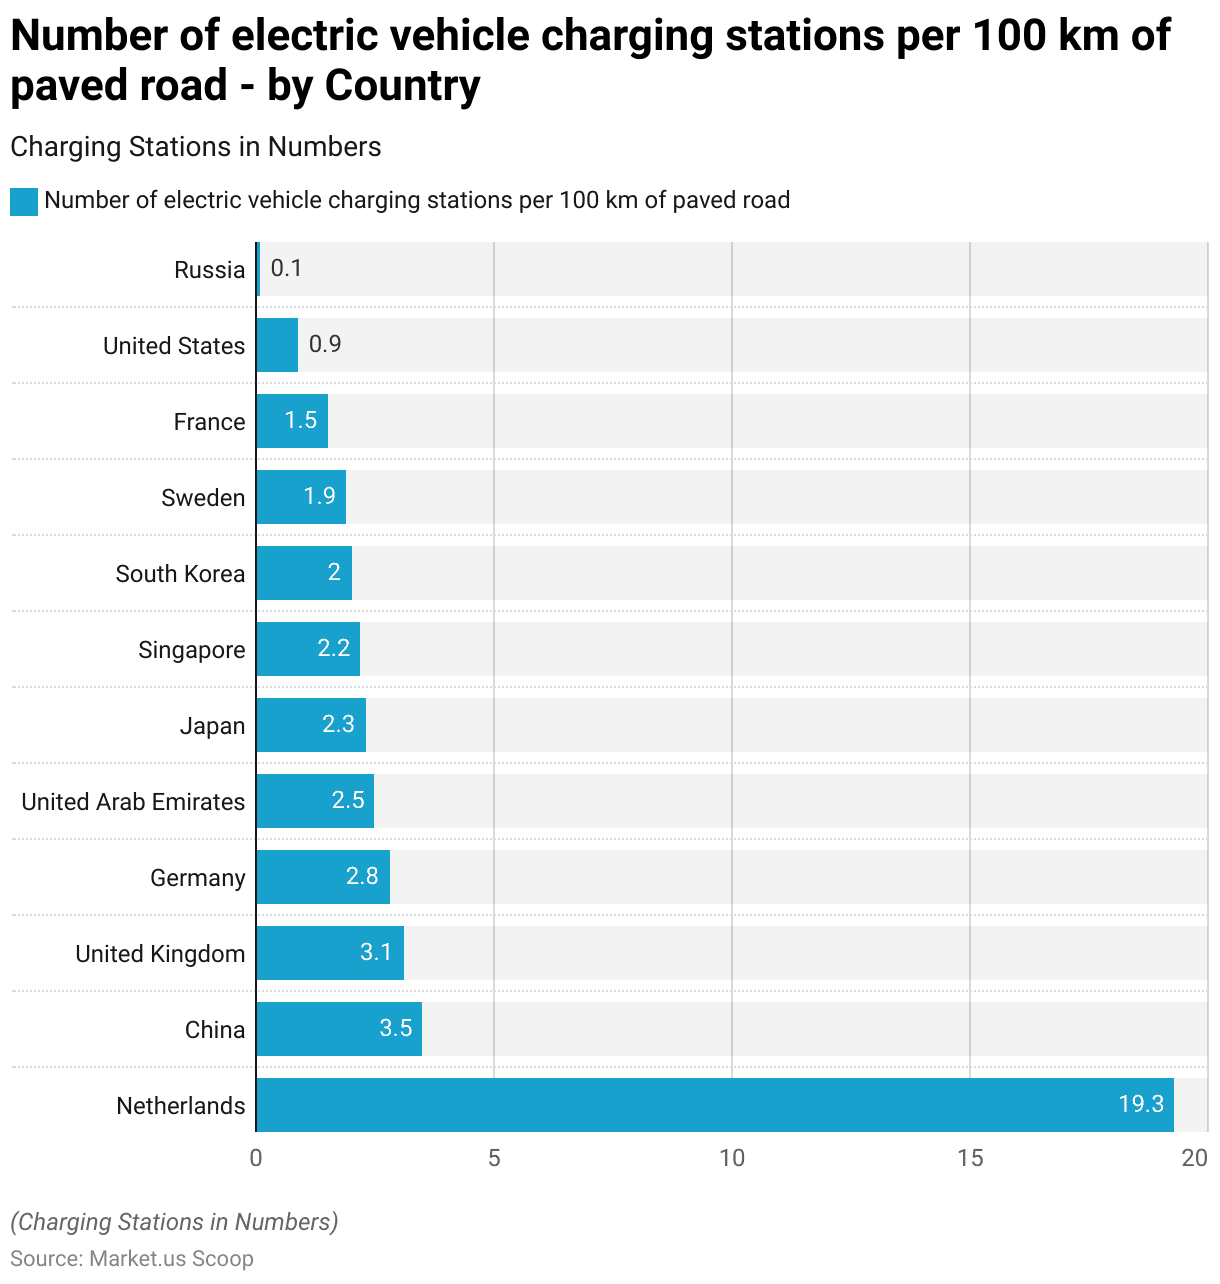
Number of Electric Vehicle Charging Stations Per 100 Kilometers
- In terms of the number of electric vehicle charging stations per 100 kilometers of paved road, the
- The Netherlands has 19.3 charging stations, indicating a robust infrastructure to support electric vehicle adoption.
- China follows with 3.5 charging stations, reflecting the country’s significant efforts in expanding its charging network.
- The United Kingdom and Germany have 3.1 and 2.8 charging stations, respectively, showcasing their commitment to electric mobility.
- The United Arab Emirates and Japan have 2.5 and 2.3 charging stations, respectively, indicating growing infrastructure development in these regions.
- Singapore and South Korea follow closely with 2.2 and 2.0 charging stations, respectively.
- Sweden has 1.9 charging stations, while France has 1.5, demonstrating efforts to bolster electric vehicle infrastructure.
Electric Vehicle Charging Infrastructure Trends
Quarterly Growth of EVSE Ports by Access
- The quarterly growth of Electric Vehicle Supply Equipment (EVSE) ports, categorized by access type, reveals fluctuating trends from 2019 to 2021.
- In the fourth quarter of 2019, private EVSE ports experienced a growth rate of 3.20%, while public ports grew by 7.60%.
- In the second quarter of 2020, private ports saw a growth rate of 4.30%, whereas public ports grew by 7.00%.
- By the second quarter of 2021, private and public port growth rates declined further, with private ports increasing by 0.50% and public ports by 3.30%.

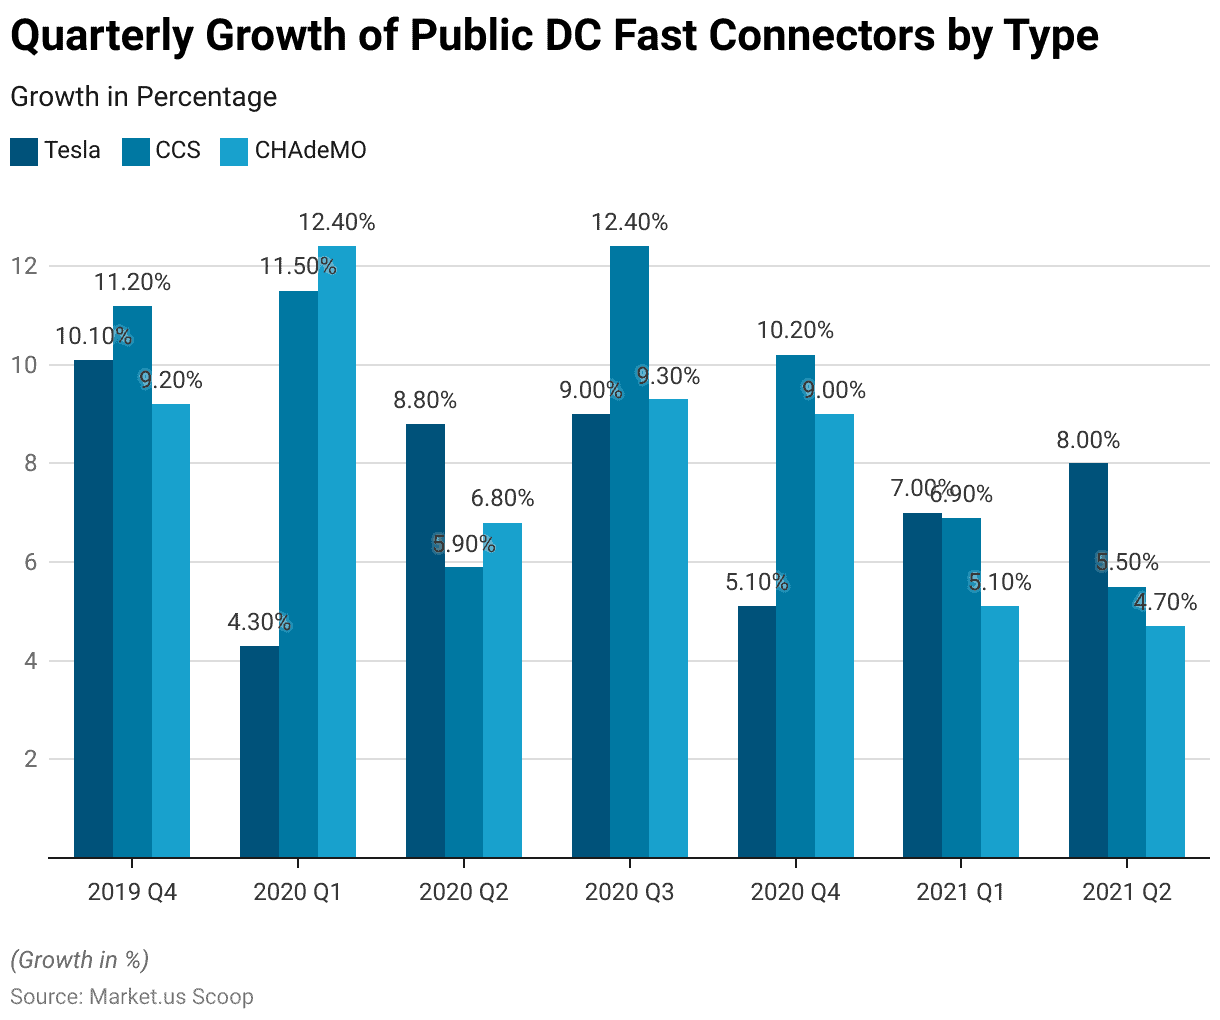
Quarterly Growth of Public DC Fast Connectors by Type
- The quarterly growth of Public DC Fast Connectors, categorized by connector type, demonstrates varying trends from 2019 to 2021.
- In the fourth quarter of 2019, Tesla connectors experienced a growth rate of 10.10%, while CCS and CHAdeMO connectors grew by 11.20% and 9.20%, respectively.
- Moving into 2020, the first quarter saw growth rates of 4.30% for Tesla, 11.50% for CCS, and 12.40% for CHAdeMO connectors.
- Transitioning into 2021, the first quarter saw growth rates of 7% for Tesla, 6.90% for CCS, and 5.10% for CHAdeMO connectors.
- In the second quarter of 2021, growth rates were 8% for Tesla, 5.50% for CCS, and 4.70% for CHAdeMO connectors.
Growth Quarterly of Public EVSE Ports by Charging Level
- The quarterly growth of public Electric Vehicle Supply Equipment (EVSE) ports, segmented by charging level, shows varying trends from 2019 to 2021.
- In the fourth quarter of 2019, DC charging ports experienced a growth rate of 10.60%, while Level 2 (L2) and Level 1 (L1) ports grew by 7.20% and 0.70% respectively.
- Transitioning into 2020, the first quarter saw growth rates of 6.80% for DC ports, 3.10% for L2 ports, and -1.10% for L1 ports.
- In the second quarter of 2021, growth rates were 6.50% for DC ports, 2.70% for L2 ports, and -3.70% for L1 ports.

Critical Investments in EV Charging Infrastructure
- The Infrastructure Investment and Jobs Act (IIJA), passed in November 2021, marks the most substantial infrastructure investment since the New Deal.
- It earmarks $7.5 billion for EV charging infrastructure, $5 billion for electric school buses, and $5.6 billion for electric transit buses, aiming to promote electric transportation. This funding addresses the shortage of charging infrastructure, a critical barrier to widespread EV adoption.
- In February 2024, the Healey-Driscoll Administration unveiled a $50 million investment plan to expand electric vehicle (EV) charging infrastructure throughout Massachusetts.
- In January 2024, BluSmart, a domestic electric vehicle platform, announced a $25 million investment from Switzerland-based responsAbility Investments AG. The funding aims to bolster BluSmart’s nationwide expansion of EV charging infrastructure.
Discuss your needs with our analyst
Please share your requirements with more details so our analyst can check if they can solve your problem(s)