


Table of Contents
- Farmers Insurance Market Size
- Top Market Takeaways
- Farmers Insurance Market Overview
- Top Driving Factors
- Drivers Impact Analysis
- Risk Impact Analysis
- Investor Type Impact Matrix
- Technology Enablement Analysis
- US Market Size
- Investment and Business Benefits
- Regulatory Environment
- Key Market Segments
- Report Scope
Farmers Insurance Market Size
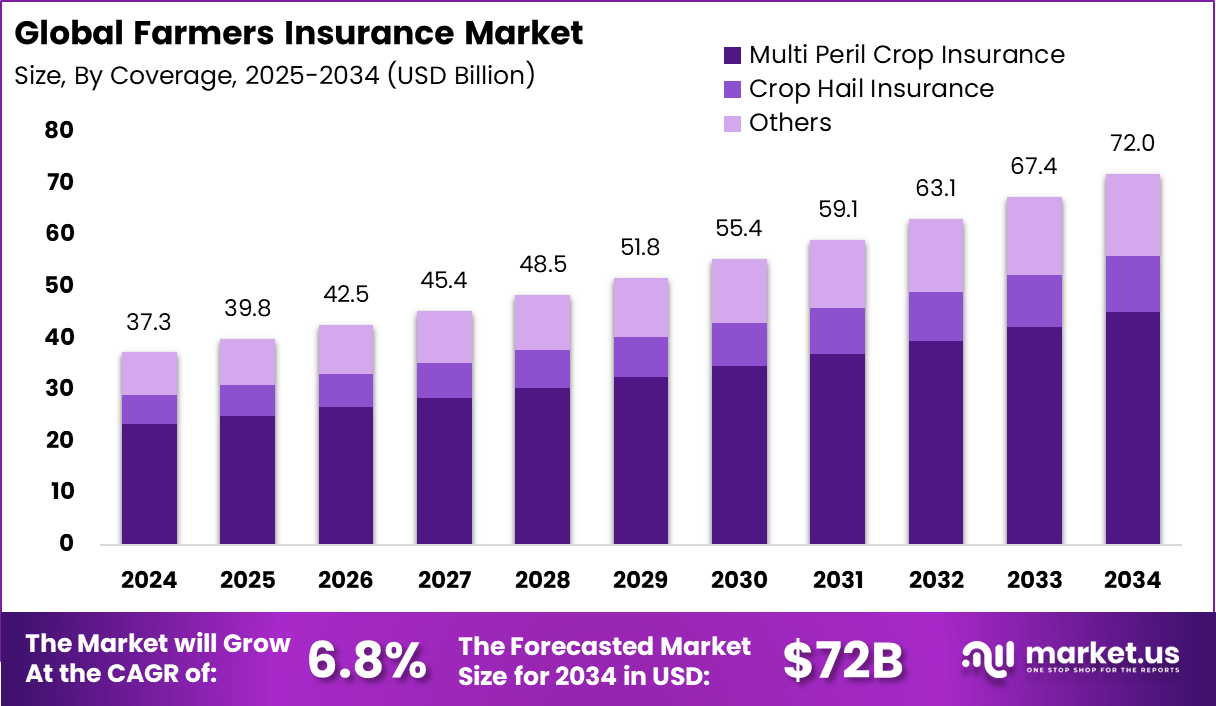
The global Farmers Insurance market generated USD 37.3 billion in 2024 and is expected to show steady expansion over the coming years. Revenue is projected to increase from USD 39.8 billion in 2025 to nearly USD 72 billion by 2034, reflecting a CAGR of 6.8% during the forecast period. This growth is supported by rising awareness of crop protection and income security among farming communities. Increasing climate related risks have also strengthened demand for insurance coverage in the agricultural sector.
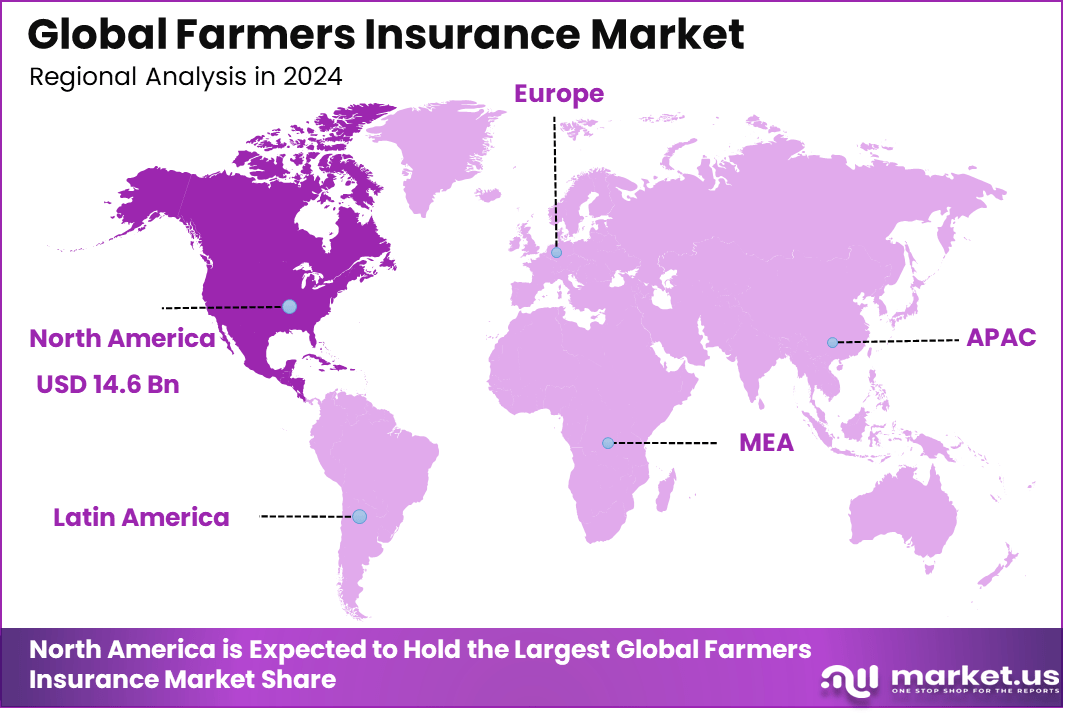
In 2024, North America held a dominant position in the global market, accounting for more than 39.2% of total revenue. The region generated approximately USD 14.6 billion, supported by well established insurance systems and strong policy adoption among farmers. Advanced risk assessment practices and government support programs further contributed to regional leadership. As a result, North America continued to play a central role in shaping market development.
Top Market Takeaways
- Multi-Peril Crop Insurance led the market with 62.7%, as farmers increasingly sought broad protection against weather volatility, pest damage, and yield uncertainty.
- Insurance companies captured 48.3% of distribution share, supported by strong rural networks and established expertise in managing agricultural risk.
- North America accounted for 39.2% of the global market, backed by mature insurance systems and consistent government support for farm protection.
- The US market reached USD 13.16 billion in 2024 and is growing at a 5.6% CAGR, driven by rising climate-related risks, diversified cropping patterns, and wider enrollment in federal insurance programs.
Farmers Insurance Market Overview
The Farmers Insurance market refers to the collection of insurance products and services offered to individuals, businesses, and agricultural clients under the Farmers brand and affiliated distributors. These offerings include property, casualty, auto, life, and specialty insurance designed to mitigate various financial risks. Market activities are executed through an extensive network of agents, brokers, and digital channels that support policy issuance, claims handling, and customer service. The market is shaped by demographic needs for financial protection, regulatory compliance, and evolving risk landscapes.
Growth in this market is influenced by the increasing complexity of risk exposures faced by modern households and businesses. Natural disasters, economic uncertainty, and rising asset values have heightened the perceived need for comprehensive insurance coverage. Farmers Insurance has responded by expanding its portfolio and enhancing service delivery through digital platforms and analytics. As risk profiles evolve, demand for tailored insurance solutions has become more pronounced.
Top Driving Factors
One primary driver of the Farmers Insurance market is the rising awareness of risk and financial protection needs among consumers. Individuals and business owners are increasingly seeking coverage that safeguards against loss from accidents, damage, and liability exposures. Educational campaigns and agent engagement have reinforced the importance of having adequate insurance. This heightened risk consciousness supports greater market participation.
Another driving factor is the expansion of digital distribution and service channels. Online platforms, mobile applications, and automated underwriting have streamlined the customer journey from quote to claims settlement. These technological developments have increased accessibility and reduced transaction times. As a result, more customers are engaging with Farmers Insurance products through convenient digital means.
Drivers Impact Analysis
| Driver Category | Key Driver Description | Estimated Impact on CAGR (%) | Geographic Relevance | Impact Timeline |
|---|---|---|---|---|
| Climate risk exposure | Rising frequency of droughts, floods, and crop losses | ~2.1% | North America, Asia Pacific | Short to Mid Term |
| Government backed schemes | Subsidized insurance programs improving farmer participation | ~1.7% | North America, Europe, Asia Pacific | Mid Term |
| Growth in commercial farming | Expansion of high value and export oriented crops | ~1.3% | North America, Latin America | Long Term |
| Digital insurance distribution | Use of mobile and online policy platforms | ~1.0% | Global | Short Term |
| Credit linked insurance | Mandatory coverage tied to agricultural loans | ~0.7% | Emerging Markets | Mid Term |
Risk Impact Analysis
| Risk Category | Risk Description | Estimated Negative Impact on CAGR (%) | Geographic Exposure | Risk Timeline |
|---|---|---|---|---|
| High claim ratios | Severe weather events increasing payout frequency | ~2.4% | North America, Asia Pacific | Short Term |
| Climate modeling gaps | Difficulty in accurately pricing extreme risks | ~1.8% | Global | Mid Term |
| Fraud and misreporting | Inaccurate loss reporting affecting insurer margins | ~1.3% | Emerging Markets | Short Term |
| Regulatory uncertainty | Changes in subsidy and support structures | ~0.9% | Global | Mid Term |
Investor Type Impact Matrix
| Investor Type | Adoption Level | Contribution to Market Growth (%) | Key Motivation | Investment Behavior |
|---|---|---|---|---|
| Government agencies | Very High | ~36% | Rural stability and food security | Long term funding support |
| Insurance providers | High | 29% | Premium growth and risk diversification | Portfolio expansion |
| Reinsurers | Moderate | ~17% | Risk spreading | Capacity based investment |
| Banks and lenders | Moderate | ~12% | Loan protection | Credit linked policies |
| Agritech platforms | Low to Moderate | ~6% | Data driven underwriting | Strategic partnerships |
Technology Enablement Analysis
| Technology Layer | Enablement Role | Impact on Market Growth (%) | Adoption Status |
|---|---|---|---|
| Satellite imagery | Crop monitoring and damage assessment | ~2.3% | Growing |
| Weather analytics | Risk modeling and premium pricing | ~1.9% | Growing |
| Mobile insurance platforms | Policy access and claim filing | ~1.4% | Mature |
| AI based underwriting | Automated risk assessment | ~0.8% | Developing |
| Blockchain records | Claim transparency and trust | ~0.4% | Early |
US Market Size
In the United States, the market is valued at about USD 13.16 billion, expanding at a 5.6% CAGR.
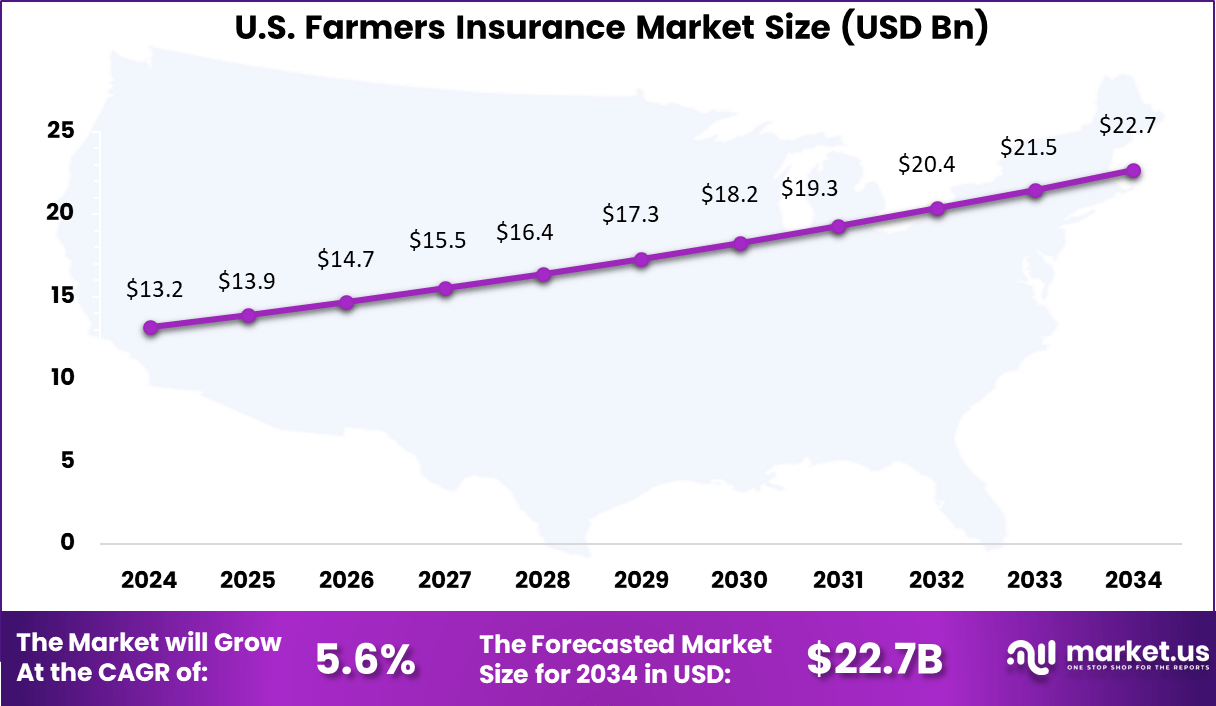
In 2024, North America represents 39.2% of the global farmers insurance market, supported by structured farm subsidy policies, advanced risk modeling, and strong institutional participation.
Investment and Business Benefits
Investment opportunities within the Farmers Insurance market exist in platforms that enhance customer experience and operational scalability. Digital tools that support real time policy customization and instant quotes can attract new customer segments. Investments in analytics driven risk modeling can also strengthen pricing accuracy and competitive positioning. These developments can yield improved financial performance over time.
Another opportunity lies in expanding advisory and value added services that support risk prevention and mitigation. Services such as safety programs, educational resources, and predictive alerts can differentiate offerings in a competitive landscape. Partnerships with technology providers and risk management firms can enrich service portfolios. Strategic investments in these areas may unlock additional revenue streams.
Adoption of Farmers Insurance products can improve financial stability for individuals and enterprises facing varying risk exposures. Insurance protection reduces the need for large reserves set aside for potential losses. This allows resources to be allocated toward growth oriented activities rather than emergency contingencies. Over time, insured entities can maintain continuity and resilience in the face of disruptions.
Insurers also benefit from diversified revenue streams across product lines and customer segments. A broad portfolio provides balance in risk pools and supports long term sustainability. Enhanced customer insights derived from data can inform product development and cross selling strategies. These benefits contribute to stronger market presence and operational resilience.
Regulatory Environment
The regulatory environment for the Farmers Insurance market includes requirements related to licensing, solvency, and consumer protection. Insurance regulators enforce standards that ensure companies maintain adequate capital and operate with transparency. Compliance with these regulations protects policyholders and reinforces market integrity. Insurers must regularly report financial performance and adhere to consumer fairness guidelines.
Regulations also govern policy terms, pricing practices, and claims handling procedures. These frameworks are designed to prevent discriminatory practices and ensure equitable treatment of customers. Data privacy and cybersecurity regulations influence how customer information is stored and processed within digital platforms. Adherence to regulatory obligations is fundamental to lawful and ethical market participation.
Key Market Segments
By Coverage
- Multi Peril Crop Insurance
- Crop Hail Insurance
- Others
By Distribution Channel
- Banks
- Insurance Companies
- Broker/Agents
- Others
Top Key Players in the Market
- Great American Insurance Company
- American International Group, Inc.
- Agriculture Insurance Company of India Limited
- Tokio Marine HCC
- FBL Financial Group, Inc
- Kshema General Insurance Limited
- QBE Insurance Ltd.
- Chubb
- Zurich
- Sompo
- Others
Report Scope
| Report Features | Description |
|---|---|
| Market Value (2024) | USD 37.3 Bn |
| Forecast Revenue (2034) | USD 72 Bn |
| CAGR(2025-2034) | 6.8% |
| Base Year for Estimation | 2024 |
| Historic Period | 2020-2023 |
| Forecast Period | 2025-2034 |
Discuss your needs with our analyst
Please share your requirements with more details so our analyst can check if they can solve your problem(s)