


Table of Contents
Introduction
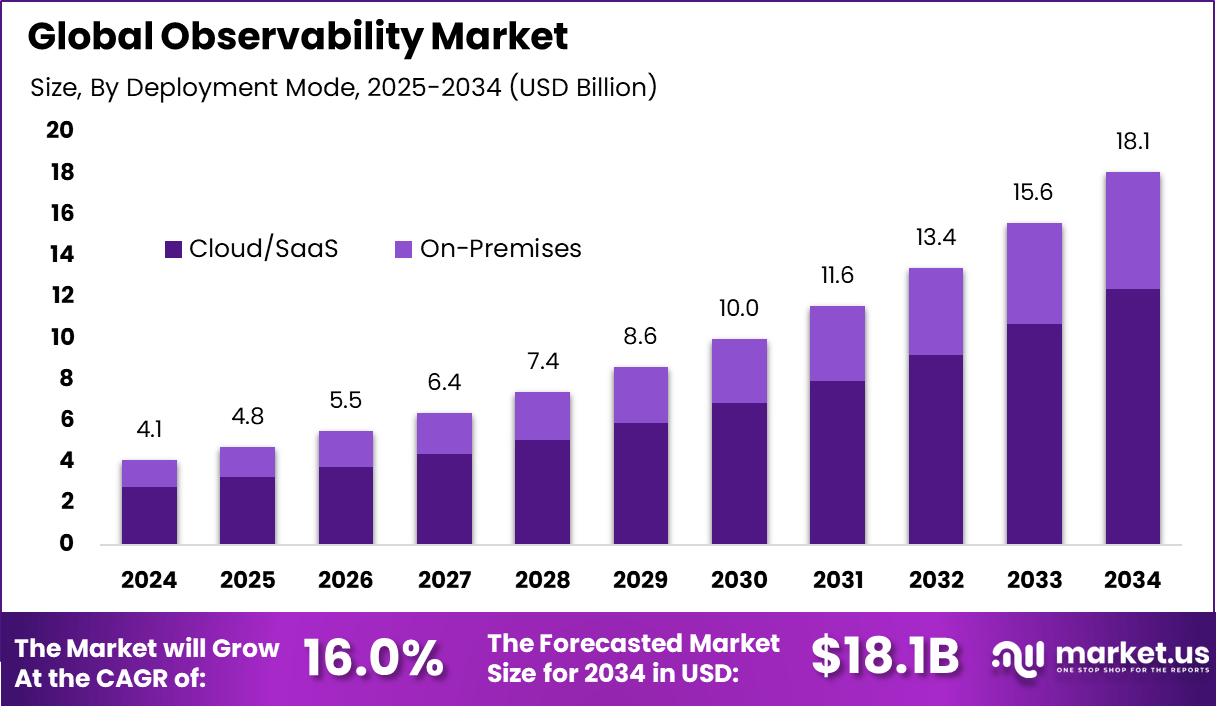
The global Observability market generated USD 4.1 billion in 2024 and is expected to expand steadily over the forecast period. Market revenue is projected to grow from USD 4.8 billion in 2025 to approximately USD 18.1 billion by 2034, reflecting a CAGR of 16% throughout the forecast span. This growth is driven by rising complexity of cloud native systems and increasing demand for real time performance visibility. Organizations are investing in observability tools to improve system reliability and operational efficiency.
The observability market refers to tools and platforms that help organizations understand the internal state of complex digital systems by analyzing telemetry data such as logs, metrics, and traces. These solutions provide real time visibility into application performance, infrastructure health, and user experience across distributed environments. Observability platforms are widely used in cloud native, microservices, and hybrid IT architectures. Their purpose is to enable faster detection, diagnosis, and resolution of system issues.
Market development has been driven by increasing system complexity and the shift toward cloud based and containerized applications. Traditional monitoring tools are often insufficient for modern, highly dynamic environments. Observability solutions address this gap by correlating multiple data signals into a unified operational view. As digital services become mission critical, observability has become a core requirement for reliable operations.
Top Market Takeaways
- Solutions led the market with a 72.9% share, indicating that enterprises increasingly favor integrated observability platforms that provide end to end visibility rather than isolated monitoring tools.
- Cloud and SaaS deployment accounted for 68.6%, reflecting strong demand for scalable, flexible, and remotely managed observability systems that align with modern cloud native environments.
- Large enterprises represented 65% of adoption, driven by complex application architectures, distributed workloads, and the need for real time performance and reliability insights.
- The IT and telecom sector generated 30.2% share, supported by continuous network operations, high traffic volumes, and strict uptime and service quality requirements.
- North America held a leading 37.9% share, backed by early cloud migration, mature DevOps and SRE practices, and well established digital infrastructure.
Regional Analysis
In 2024, North America held a dominant position in the global market, accounting for more than 37.9% of total revenue. The region generated around USD 1.5 billion, supported by strong adoption of cloud computing and advanced IT operations practices. High concentration of digital enterprises and early use of DevOps methodologies strengthened regional leadership. As a result, North America continued to influence observability adoption and market development.

Top Driving Factors
One major driving factor of the observability market is the widespread adoption of cloud computing and microservices architectures. These environments generate large volumes of distributed telemetry data that must be analyzed in real time. Observability tools enable teams to track dependencies and performance across services. This capability supports stability in complex application ecosystems.
Another key driver is the growing business impact of downtime and performance degradation. Digital services directly affect revenue, customer satisfaction, and brand trust. Organizations require proactive tools to identify issues before they escalate. Observability platforms support this need through real time insights and automated alerts.
Demand Analysis
Demand for observability solutions is influenced by enterprise digital transformation initiatives. As organizations modernize applications and infrastructure, they require deeper visibility into system behavior. Development and operations teams rely on observability to manage frequent updates and continuous delivery pipelines. This demand is strong across technology, finance, retail, and telecommunications sectors.
Demand is also shaped by the rise of remote and hybrid work models. Distributed teams need centralized visibility to collaborate effectively on incident response. Observability platforms provide shared dashboards and context that support faster coordination. This operational requirement continues to support steady market demand.
Increasing Adoption Technologies
Artificial intelligence and machine learning technologies are increasingly integrated into observability platforms. These technologies analyze telemetry data to detect anomalies and predict potential failures. Automated root cause analysis reduces manual investigation time. AI driven insights enhance operational efficiency and accuracy.
Cloud native technologies also support adoption by enabling scalable data collection and processing. Observability platforms are designed to handle high velocity data streams generated by containers and serverless workloads. Integration with cloud services simplifies deployment and management. These capabilities align with modern infrastructure strategies.
Key Reasons for Adopting These Solutions
One key reason organizations adopt observability solutions is faster incident detection and resolution. Unified visibility across systems allows teams to identify issues quickly and understand their impact. Reduced mean time to resolution improves service reliability. This operational benefit is critical for customer facing applications.
Another reason is improved collaboration between development and operations teams. Observability provides shared context and data that reduce communication gaps. Teams can align on performance goals and system behavior. This supports more efficient DevOps and site reliability practices.
Investment Opportunities
Investment opportunities in the observability market exist in platforms that support full stack visibility across applications, infrastructure, and user experience. Solutions that unify telemetry data into a single platform are increasingly valued. Investors may focus on vendors that simplify deployment and reduce tool sprawl. Integrated approaches offer strong differentiation.
Another opportunity lies in observability solutions tailored for specific environments such as cloud native, edge computing, or regulated industries. Specialized platforms can address unique compliance and performance needs. Expansion into these segments supports long term growth potential. Focused innovation can strengthen market positioning.
Business Benefits
Adoption of observability solutions improves system reliability and operational resilience. Organizations can maintain consistent service levels by proactively identifying performance issues. Reduced downtime leads to cost savings and improved customer satisfaction. These benefits support overall business continuity.
Observability also enables data driven optimization of applications and infrastructure. Insights into resource usage and performance trends support informed capacity planning. Organizations can improve efficiency while controlling operational costs. This strategic visibility strengthens long term IT performance.
Regulatory Environment
The regulatory environment for the observability market is influenced by data protection and security requirements. Telemetry data may include sensitive operational or user information. Organizations must ensure observability tools comply with privacy regulations. Secure data handling and access controls are essential.
Industry specific compliance requirements also affect observability adoption. Sectors such as finance and healthcare require auditability and traceability of system behavior. Observability platforms support compliance by providing detailed logs and historical records. Alignment with regulatory standards enhances trust and adoption across regulated environments.
Key Market Segments
By Component
- Solutions
- Services
By Deployment Mode
- Cloud / SaaS
- On-Premises
- Hybrid
By Enterprise Size
- Small and Medium Enterprises
- Large Enterprises
By End-user Vertical
- IT and Telecom
- BFSI
- Retail and E-commerce
- Manufacturing
- Healthcare and Life Sciences
- Government and Defense
- Other End-user Verticals
By Application
- DevOps and APM
- Infrastructure Monitoring
- Security and Compliance
- Data Observability
- Business Analytics
- Others
Top Key Players in the Market
- GitLab B.V.
- Broadcom Inc.
- Dynatrace LLC
- IBM Corporation
- LogicMonitor Inc.
- Others
Report Scope
| Report Features | Description |
|---|---|
| Market Value (2024) | USD 4.1 Bn |
| Forecast Revenue (2034) | USD 18.1 Bn |
| CAGR(2025-2034) | 16.0% |
| Base Year for Estimation | 2024 |
| Historic Period | 2020-2023 |
| Forecast Period | 2025-2034 |
| Report Coverage | Revenue forecast, AI impact on Market trends, Share Insights, Company ranking, competitive landscape, Recent Developments, Market Dynamics and Emerging Trends |
Discuss your needs with our analyst
Please share your requirements with more details so our analyst can check if they can solve your problem(s)