Market Overview
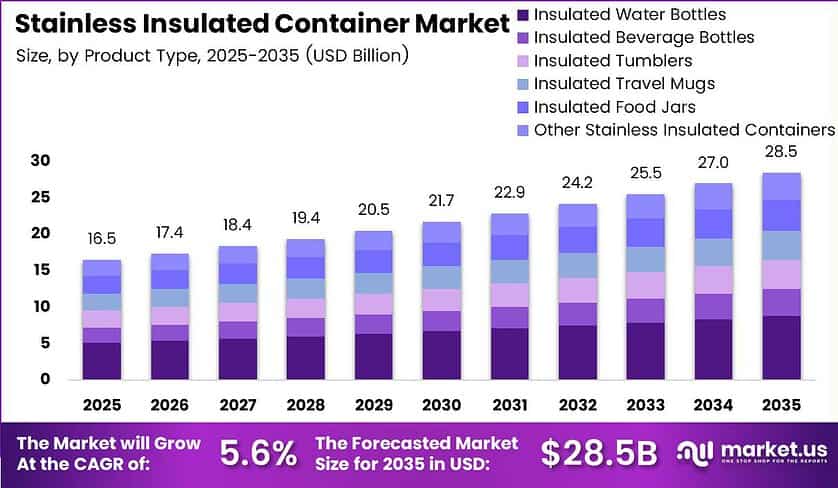
The global stainless insulated container market reaches USD 28.5 billion by 2035, up from USD 16.5 billion in 2025. Analysts project a 5.6% CAGR during the 2026 to 2035 forecast period. This growth reflects rising demand for reusable drinkware that keeps beverages hot or cold.
Stainless insulated containers are food-grade steel vessels that use vacuum or multi-wall barriers to hold hot and cold temperatures. Consumers use them for hydration, caterers for food service, and institutions for storage. Consequently, brand owners capture repeat replacement margins across retail and commercial fleets.
Data-Driven Insights for Smarter Business Decisions: Explore the Full Report
Key Takeaways
- The market was valued at USD 16.5 billion in 2025 and will reach USD 28.5 billion by 2035.
- The market expands at a 5.6% CAGR from 2026 to 2035.
- Insulated Water Bottles hold the largest product share at 31.00%.
- The 350 to 500 ml range leads capacity with 23.00%.
- Vacuum Insulated Containers capture 61.00% of the insulation segment.
- Cold Beverage Storage leads applications with 27.00%.
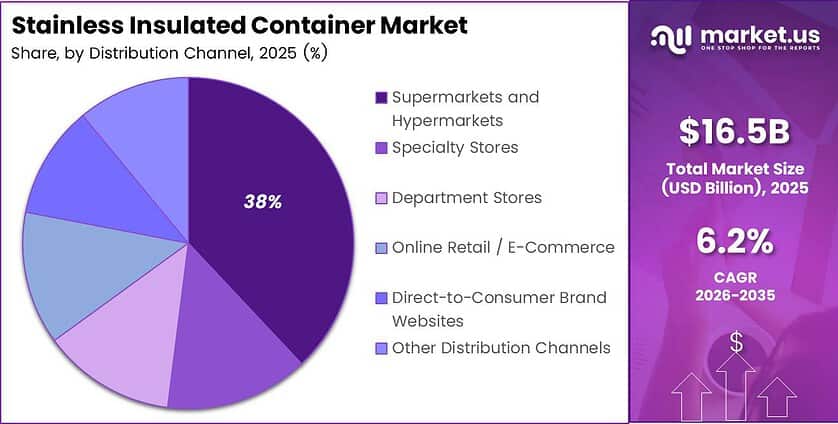
- Supermarkets and Hypermarkets hold the top channel share at 38.00%.
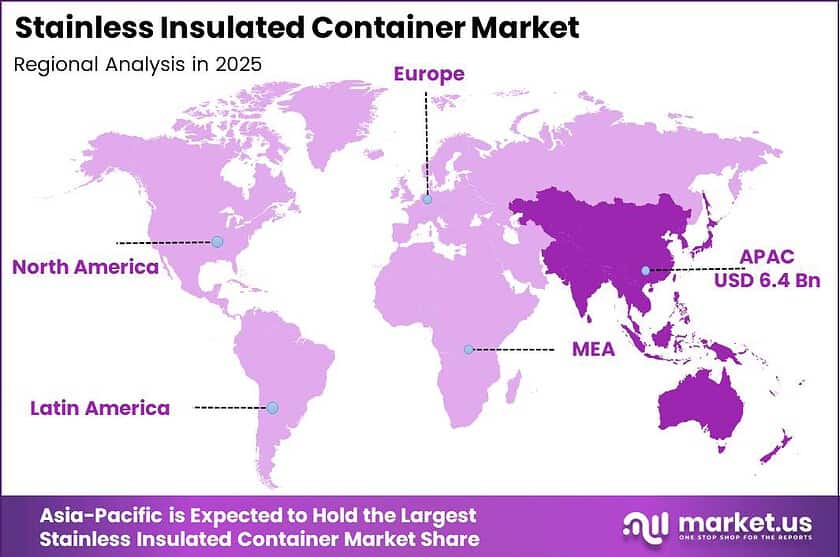
- Asia-Pacific leads with 39.00%, valued at USD 6.4 billion.
Market Segmentation Overview
Insulated Water Bottles dominate the product type segment with 31.00% share in 2025 due to daily hydration replacement needs. The WHO found 31% of adults missed recommended exercise levels in 2024. Therefore, fitness hydration lines secure high-volume recurring orders, while Beverage Bottles, Tumblers, and Travel Mugs serve other uses.
The 350 to 500 ml range leads the capacity segment with 23.00% share in 2025 due to commuter bag portability. International arrivals grew 5.0% in early 2025, and half-liter vessels fit seatback pockets and security rules. Meanwhile, Below 350 ml and 501 to 750 ml sizes serve pocket and gym use.
Vacuum Insulated Containers dominate the insulation segment with 61.00% share in 2025 due to multi-hour thermal retention. Clean electric-arc steel removes inclusions that cause micro-leaks, so manufacturers cut defect rates. Meanwhile, Double-Wall and Single-Wall options serve cost-conscious buyers at lower production costs.
Cold Beverage Storage dominates the application segment with 27.00% share in 2025 due to rising ambient cooling needs. Warmer temperatures speed heat transfer into cold drinks, so copper-lined vacuum vessels keep ice frozen for 24 hours. Additionally, Hot Beverage Storage and Food Storage serve commuters and lunch carriers.
Supermarkets and Hypermarkets hold the top channel share of 38.00% in 2025 due to high-footfall impulse visibility. End-cap displays for back-to-school and holiday hydration packs secure predictable factory utilization. However, Specialty Stores validate premium prices, and Department Stores sell gift-ready carafes and tumblers.
Drivers
Single-use plastic bans lead growth, adding 1.9 percentage points to the CAGR. Commercial foodservice operators grew bulk procurement of vacuum-insulated containers by 28.4% year over year. Consequently, reusable containers cut disposable packaging costs by 14.2% with 11-month payback, moving suppliers toward multi-year business-to-business contracts.
Outdoor recreation and premium hydration demand adds 1.1 percentage points across North America and Europe. In October 2026, a heritage drinkware maker launched a limited capsule collection using 90% recycled steel, priced from USD 45 to USD 65. Therefore, scarcity marketing expands direct-to-consumer gross margins as basic hydration lines mature.
Data-Driven Insights for Smarter Business Decisions: Explore the Full Report
Use Cases
Commuters and travelers carry half-liter bottles and travel mugs through airports, rail stations, and offices. Compact vessels fit seatback pockets and bags. Consequently, brands add micro formats, and Hydro Flask launched a 200 ml Micro bottle in 16 colorways in February 2025 to attract impulse buyers.
Moreover, corporate cafeterias, retail chains, and healthcare caterers replace disposable polymer cups with reusable steel vessels. Extended producer responsibility mandates drive this shift. Therefore, drinkware suppliers gain predictable bulk contract revenue and move from seasonal retail orders to multi-year supply agreements.
Major Challenges
Nickel and chromium price volatility drags growth by 1.1 percentage points. Alloy surcharges represent 52.0% to 64.0% of material costs, and quarterly swings reached 18.0% to 31.0%. Consequently, fabricators sign hedging contracts, hold larger coil buffers, and thin walls from 0.6 millimeters to 0.4 millimeters.
However, anti-dumping duties and import tariffs restrain growth by 1.3 percentage points. Duties of 15.0% to 25.0% raised landed unit costs by 19.4% since 2025. Therefore, importers unable to pass on costs face margin compression of 320 to 450 basis points and delay tooling investments.
Data-Driven Insights for Smarter Business Decisions: Explore the Full Report
Business Opportunities
RFID-enabled Container-as-a-Service ecosystems offer the top opportunity, with 1.6 points of potential CAGR upside. Leasing at USD 0.08 to USD 0.15 per wash-and-fill cycle lifts margins above 54.0% versus 28.0% on hardware. Therefore, restaurants, stadiums, and hospitals can raise container recovery rates from 62.0% to 96.5%.
Moreover, certified green steel low-carbon vessel lines add 1.2 points of upside in Europe and North America. Recycled metallurgy appeals to eco-conscious buyers, as Klean Kanteen expanded its 90.0% post-consumer recycled steel portfolio in October 2025. Consequently, brands with certified low-carbon vessels can win premium pricing and institutional tenders.
Regional Analysis
Asia-Pacific leads with 39.00% share, valued at USD 6.4 billion in 2025. Asian stainless steel melt shop output grew 2.7% to 55.31 million tonnes. Co-located cold-rolling mills and vacuum-brazing clusters in China, Japan, and Thailand cut freight costs, so global drinkware brands rely on Asian contract manufacturers.
However, North America offers a high-margin market driven by outdoor lifestyle culture and seasonal gifting. NRF counted 202.9 million shoppers over the 2025 Thanksgiving weekend, beating forecasts of 186.9 million. Therefore, brands with agile North American warehouse networks capture superior fourth-quarter margins.
Recent Developments
- August 2026 — Zojirushi launched the SX-MAH Stainless Carry Tumbler with a leak-proof straw lid.
- October 2025 — Klean Kanteen expanded its 90.0% recycled steel flasks across 12 oz to 64 oz sizes.
- October 2025 — Tiger released the MJF-A vacuum bottles in 240 ml, 360 ml, and 480 ml.
- September 2025 — LocknLock launched Metro Cafe Ceramic Tumblers from 400 ml to 1.2 L with 72 hours cold retention.
- September 2025 — Tiger introduced MCZ and MTA vacuum bottles from 0.4 L to 0.8 L with integrated gasket stoppers.
- March 2025 — Hydro Flask unveiled its Spring 2025 collection with a 24 oz Travel Tumbler.
- September 2024 — Tiger released MKR one-push vacuum mugs in 0.35 L, 0.5 L, and 0.6 L sizes.
- March 2024 — Zhejiang Haers broke ground on a USD 350 million Yongkang park adding 23 million flasks.
Conclusion
The stainless insulated container market grows from USD 16.5 billion in 2025 at a 5.6% CAGR. Plastic bans and premium hydration demand power this momentum. Consequently, brands shift from seasonal retail orders toward multi-year institutional contracts and recurring replacement sales.
Insulated Water Bottles, 350 to 500 ml, Vacuum Insulated, Cold Beverage Storage, and Supermarkets lead their segments with 31.00%, 23.00%, 61.00%, 27.00%, and 38.00% shares. Moreover, Asia-Pacific commands 39.00% of revenue, supported by dense metalworking clusters and integrated supply chains.
Companies must act on two priorities. First, manufacturers should hedge nickel and chromium costs and diversify assembly beyond tariff-exposed routes. Additionally, they should build leasing, RFID, and low-carbon steel offerings. Therefore, early movers can capture growth as the market reaches USD 28.5 billion by 2035.
Looking for data tailored to your specific market, region, or business need? Request a custom report or consultation — write to us at sales@market.us
Discuss your needs with our analyst
Please share your requirements with more details so our analyst can check if they can solve your problem(s)