
Market Overview
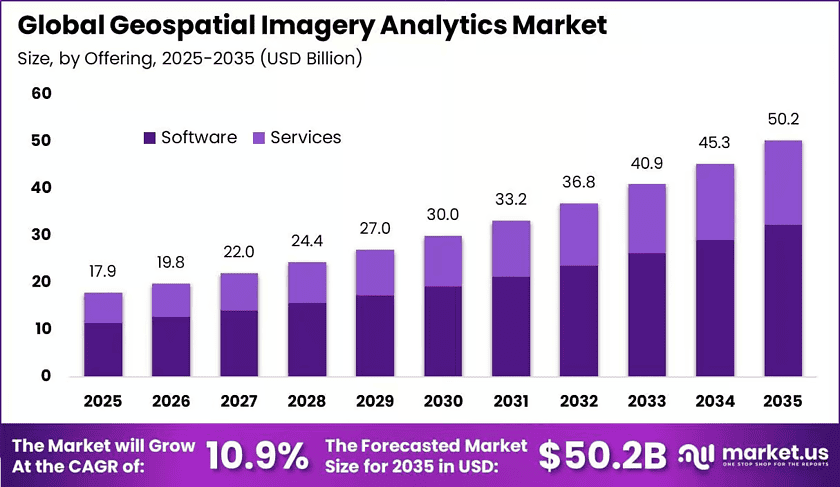
New York, NY – November 19, 2026 – The Global Geospatial Imagery Analytics Market reached USD 17.9 billion in 2025. Analysts project the market to hit about USD 50.2 billion by 2035, growing at a 10.9% CAGR from 2026 to 2035. This steady growth shows that more organizations now turn satellite, drone, and aerial images into business decisions. North America led the global market in 2025 with more than a 38.7% share and about USD 6.9 billion in revenue.
Additionally, construction activity is creating strong demand for these tools. According to the U.S. Census Bureau, U.S. construction spending reached an annual rate of USD 2.14 trillion in June 2025. Large projects of this size need imagery analytics to track progress, inspect assets, and find project risks early.
Furthermore, drone use keeps rising across many industries. According to the U.S. Federal Aviation Administration, the commercial small-drone fleet should pass 1 million units in 2025 and reach nearly 1.118 million by 2029. This growing fleet produces more images, so companies need better mapping and image-processing software.
However, the value of public data matters just as much. According to NASA, free Landsat data generated about USD 25.6 billion in economic value for the U.S. in 2023. This figure shows that open imagery supports real business returns. Therefore, organizations adopt automated platforms for image sorting, change detection, and faster decision.
Key Takeaways
- The Geospatial Imagery Analytics Market reached USD 17.9 billion in 2025 and should reach USD 50.2 billion by 2035 at a 10.9% CAGR.
- Software Segment: The software segment led the market in 2025 with more than a 64.2% share.
- Image-Based Analytics Segment: Image-based analytics led the market in 2025 with more than a 70.6% share.
- Satellite Imagery Segment: Satellite imagery held the top position in 2025 with more than a 32.8% share.
- Surveillance and Monitoring Segment: Surveillance and monitoring held more than a 21.2% share in 2025.
- Government and Defense Segment: Government and defense led the market in 2025 with more than a 26.1% share.
- North America led the market in 2025 with a 38.7% share and USD 6.9 billion in revenue.
➤ See the Full TOC, Market Tables & Figures in Your Sample Copy – https://market.us/report/geospatial-imagery-analytics-market/request-sample/
Market Segmentation
By Offering
Software led the market in 2025 with more than a 64.2% share. Users need software to turn raw images into land maps, flood lines, crop-health signals, and 3D models. Consequently, software tools sit at the center of most spatial data projects and earn the largest share of spending.
Moreover, data volumes keep growing fast. According to the European Space Agency, Copernicus Sentinel missions generate more than 20 TB of data each day. This flood of data is too large for manual review. Therefore, buyers invest in software that can process and analyze imagery automatically.
By Data Modality
Image-based analytics led in 2025 with more than a 70.6% share. Satellite, aerial, and drone images help teams track damaged buildings, flooded land, and forest loss over wide areas. As a result, this method remains the most common way to monitor physical changes quickly.
Additionally, disaster response supports this segment. According to the Copernicus Emergency Management Service, the program recorded 81 mapping activations in 2025 and produced 812 rapid-mapping products. These numbers show that emergency teams depend on fast image analysis during floods, storms, wildfires, and earthquakes.
By Data Source
Satellite imagery held the top position in 2025 with more than a 32.8% share. Satellites cover large and remote areas again and again with steady quality. Consequently, they suit agriculture, forestry, mining, insurance, and climate monitoring, where users need regular and wide coverage.
Furthermore, user numbers keep climbing. According to the European Commission, registered Copernicus users grew from 385,000 in 2020 to 638,000 in 2022. This rise shows a fast-growing user base for satellite data. Therefore, analytics providers gain a larger pool of potential customers.
By Application
Surveillance and monitoring led in 2025 with more than a 21.2% share. This work needs regular image collection and automatic comparison, unlike one-time mapping. Consequently, users rely on analytics platforms to spot illegal land clearing, damage to infrastructure, flood spread, and vegetation loss early.
Moreover, forest protection shows the scale of this need. According to the UN Food and Agriculture Organization, deforestation averaged 10.9 million hectares each year during 2015 to 2025. This steady loss pushes governments and companies to use ongoing monitoring tools across large forest areas.
By Vertical
Government and defense led in 2025 with more than a 26.1% share. These users need steady information on borders, sea routes, military activity, and critical infrastructure. Therefore, they remain the biggest buyers of tools that turn image feeds into maps, alerts, and clear intelligence.
Additionally, defense budgets keep rising. According to NATO, European Allies and Canada raised defense spending by more than USD 90 billion in 2025. This increase gives agencies more money for surveillance and reconnaissance. Consequently, demand grows for imagery tools that support border security and asset protection.
Regional Analysis of Geospatial Imagery Analytics
North America held more than a 38.7% share in 2025 and earned about USD 6.9 billion. Moreover, U.S. agencies use spatial data for weather, border control, and disaster response. According to NOAA, the U.S. National Spatial Reference System can create more than USD 2.4 billion in yearly benefits, showing strong public value.
However, Asia Pacific should grow the fastest in the coming years. Rapid city growth, large farm areas, and frequent natural disasters drive this demand. Additionally, China, India, Japan, South Korea, and Australia keep expanding their satellite programs. Consequently, the region offers strong long-term growth for Earth observation providers.
Key Market Drivers
Defense needs drive strong demand for Earth intelligence tools. According to SIPRI, global military spending reached USD 2.71 trillion in 2024, up 9.4% in real terms. Therefore, governments fund more satellite and radar monitoring. This driver could add about 2.1% to the market’s growth rate.
Moreover, open satellite data at large scale fuels wider adoption. Programs like Copernicus give users huge free image libraries. Consequently, small firms and public bodies can build analytics without buying costly data. This driver could add about 1.8% to growth, because cheap access lowers the barrier to entry for new users.
Major Use Cases
Insurance companies use imagery analytics to check claims after floods, storms, and wildfires. Teams compare before and after images to confirm damage quickly. Consequently, insurers cut field visits and settle valid claims faster. Moreover, this approach helps reduce fraud and improves trust between insurers and their customers.
Additionally, farmers and agribusiness firms use satellite and drone images to monitor crop health. These tools spot water stress, pests, and poor soil areas early. Therefore, growers can apply water and fertilizer only where needed. This targeted approach lowers costs and improves harvest quality across large farm areas.
Business Opportunities
Parametric insurance offers a strong growth path for analytics providers. Providers can build verified event triggers and risk scores directly into insurance workflows. Consequently, insurers can pay claims automatically when a set event occurs. Moreover, this model moves vendors beyond simple data sales into higher-value software services with steady income.
Furthermore, carbon measurement and reporting creates new demand. Companies and carbon credit buyers need proof that forests and land projects actually store carbon. Therefore, satellite imagery tools can verify tree cover and land changes over time. This service helps build trust in carbon markets and opens new revenue streams.
Major Challenges
Export limits on critical minerals create a serious supply risk. Satellites, drones, and sensors depend on gallium, germanium, and rare-earth materials. However, new trade controls make these inputs harder and costlier to source. Consequently, hardware makers face longer lead times, and buyers may delay new equipment purchases.
Additionally, the industry faces a shortage of skilled workers. Firms need experts in remote sensing, GIS, data engineering, and machine learning. However, demand for these skills grows faster than supply. Therefore, companies turn to automation, reusable models, managed services, and university partnerships to close the talent gap.
Top Key Players in the Market
- IBM
- Hexagon AB
- TomTom
- Maxar Technologies
- Trimble
- Caliper Corporation
- Planet Labs
- ESRI
- L3Harris Technologies
- Oracle
- NV5 Geospatial
- RMSI
- Maplarge
- Fugro
- Blacksy
- Nearmap
- Supermap
Conclusion
The geospatial imagery analytics market shows strong and steady growth. Software, image-based analytics, satellite data, and government buyers lead current demand. Moreover, defense needs, open data, and climate risks keep pushing adoption forward. However, mineral supply limits and talent shortages remain key hurdles. Therefore, providers that offer automated, insurance-ready, and carbon-focused solutions can capture the strongest long-term value in this growing location intelligence space.
Discuss your needs with our analyst
Please share your requirements with more details so our analyst can check if they can solve your problem(s)